| Sea Ice Group at the Geophysical Institute |

|
|
Recent Visitors
Barrow Sea Ice Thickness and Sea Level
Barrow Sea Ice Mass Balance Site 2016
Data plots
Plots on this page are generated in near real-time from automatically processed data prior to human quality control.
Water Depth, Ice Thickness, Snow Depth, and Air Temperature
This plot shows the air temperature, snow depth, ice thickness and water depth measured at the mast of the Mass Balance Site for the previous 7 days.Snow depth and ice thickness are derived from acoustic sounders that take one measurement every 15 minutes. The accuracy is about ±1 cm


Temperature profile
This is the temperature profile through air, snow, ice, and water. The grayed area indicates the position of the ice (bottom may be off by 0.1 m). The bounds of the red funnel are the highest and lowest temperatures recorded during the past 24 hours. The black line with data points (spaced 0.1 m, 4 inches) is the latest temperature profile. Air, snow, ice, and water can often be discriminated easily in winter and early spring: daily temperature swings are more pronounced in the air than in the snow; the temperature profile in the ice is usually linear and steeper than in the snow; the temperature in the water is approximately independent of depth. Towards summer the ice acts as a heat sink with the coldest temperature registered inside the ice rather than in the air. Note an issue arose with the even numbered thermistors, causing them to not report the correct temperatures. In the plot above, the odd numbered thermistor temperatures are plotted, giving the profile a stepped appearance.
Temperature measurements are accurate to approx. ±0.2 °C. Further, measurements in summer may be affected by solar heating of the probe.
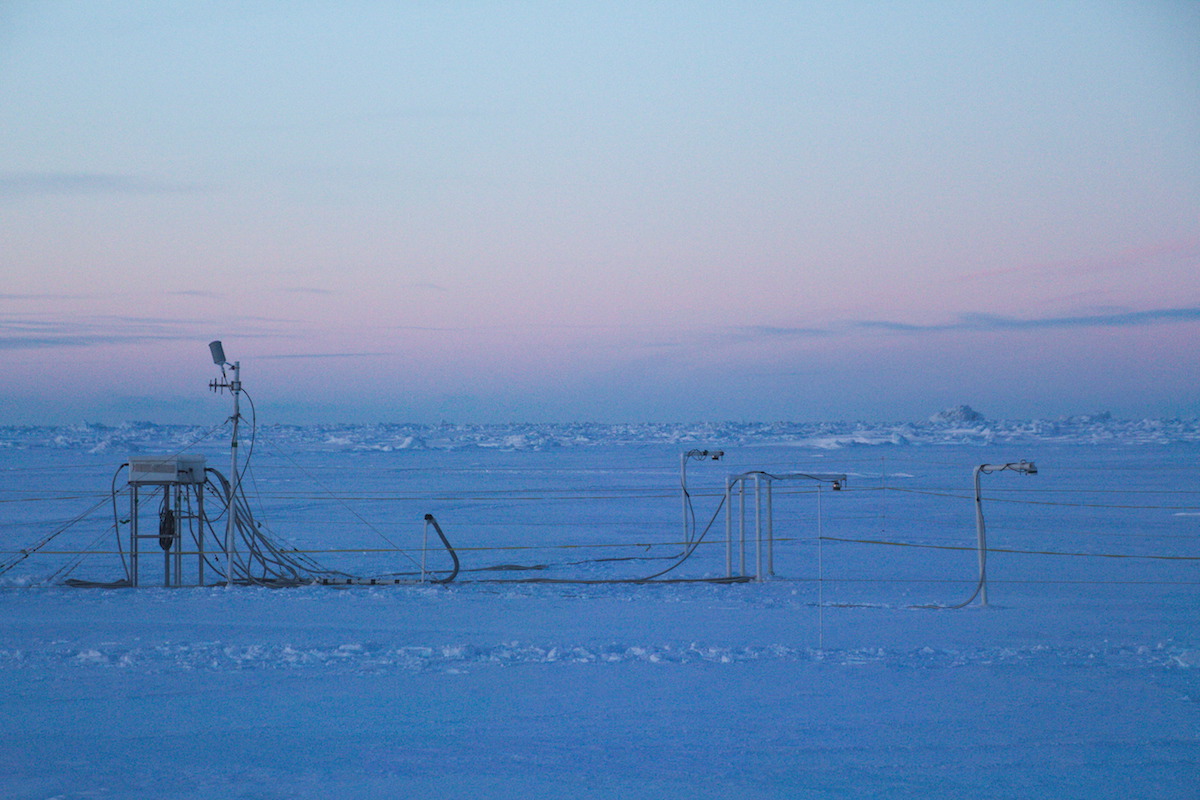
The Mass Balance Site was deployed on landfast sea ice in the Chukchi Sea at Barrow, Alaska on January 29-30, 2016. At the time, ice thickness was 0.4 to 0.5 m (about 15 in) and snow depth was 0.06 m (about 2 inches).
Ice thickness, snow depth, sea level, and temperature profiles are recorded every 15 minutes, transferred to Fairbanks, processed and presented online with approximately 5 minutes delay. On April 4, the air temperature sensor failed. The plots above display the air temperature from the topmost thermistor of the thermistor string. The snow depths use the air temperature sensor data to correct for the temperature dependent speed of sound in air until April 4, and snow depths are uncorrected after April 15. We are working to correct the snow depths with the topmost thermistor of the thermistor string temperature data for the near real time plots, though the final snow depth data at the end of the season will all be corrected with the thermistor temperature.
The probe will be recovered from the ice prior to break-up. Recovery is likely to take place in June 2016.
Overview
The Mass Balance Site consists of the following sensors:- in-ice thermistor string: temperatures at different positions above, through and below the ice
- above-ice temperature/humidy sensor: air temperature and humidity
- above-ice down-looking acoustic transducers: the position of the upper snow or ice surface
- below-ice upward-looking acoustic transducer: the position of the ice bottom
- below-ice down-looking acoustic transducer: local sea level at the Mass Balance Site
- below-ice thermistor: water temperature

Ice thickness is calculated from the distance between the upper and lower surfaces of the ice.
In winter the positions of the upper and lower surfaces allow us to determine snow accumulation and ice growth, respectively.
In spring and summer, our measurements show the thinning that takes place from above and below.
Measurements are performed every 15 minutes and transferred to a base station in Barrow through a 900 MHz UHF radio link, from where they are sent through an internet connection to Fairbanks for further processing.
Site location
The Mass Balance Site Instruments is located at 71.37219° N, 156.53828° W in a region of undeformed landfast sea ice near Barrow, Alaska. This is approximately 1 km (1/2 mile) offshore, North of Niksiuraq, the northern end of the road toward Point Barrow.
|
Acknowledgements: This project is part of Seasonal Ice Zone Observational Network (SIZONet; sizonet.org), supported by the National Science Foundation under Grant No. OPP-0856867. We gratefully acknowledge UMIAQ for logistical and technical support and the Arctic Slope Regional Corporation (ASRC) for supporting the installation of the webcam and radar. Any opinions, findings and conclusions or recommendations expressed in this material are those of the author(s) and do not necessarily reflect the views of the National Science Foundation (NSF). |
Contact: massbalance@gi.alaska.edu