
The two-week break-up forecast is currently not operational. Break-up season at Barrow is May through August.
Forecast pages of previous years are archived here:
http://seaice.alaska.edu/gi/data/barrow_breakup
Summary publication: Coastal landfast sea ice decay and break-up in northern Alaska: Key processes and seasonal prediction (pdf)
Sea Ice Break-Up Forecast
for Barrow, Alaska
for Barrow, Alaska
This is a summary

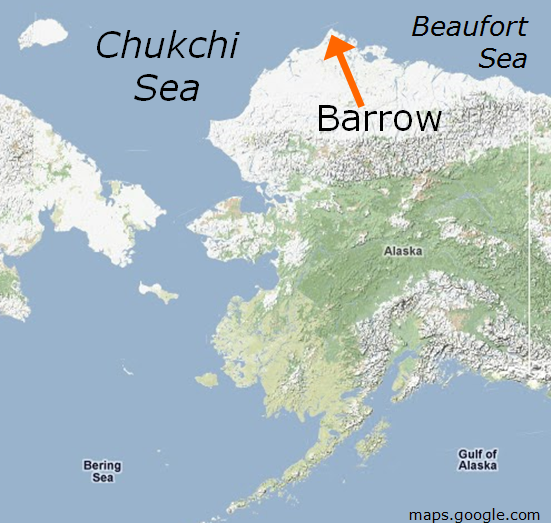
Location of Barrow
of the break-up forecast for landfast ice at the Chukchi Sea coast at Barrow, Alaska.
In typical years, the timing of break-up is associated with the amount of incoming solar energy
(i.e., essentially, how sunny or cloudy it is).
In order to predict break-up, we use a combination of data, covering
Location of Barrow
- Future Conditions: a 16-day NOAA/NCEP GFS-based WRF weather forecast (Zhang and Krieger),
- Current Conditions: NOAA aviation weather observations, and
- Recent Conditions: measurements provided by the Department of Energy Atmospheric Radiation Measurement program (ARM).
Observations
Current Ice Conditions
Here are regional ice conditions from crops of the
NASA/GSFC, Rapid Response
Arctic MODIS mosaic
of the last five days. The false-color images (bands 3-6-7) show snow and ice as red, vegetation green, and clouds white,
see Rapid Response FAQ for details. The upper two rows are from satellite Terra, the bottom row is from Aqua. Image area is approximately 50 km x 50 km (30 mi x 30 mi).
In addition, the following services provide access to projected images of the most recent and archived satellite data in the Barrow region:
GINA Swath Viewer (optical sensors) and
BAID-IMS Barrow SAR Viewer (RADAR).


False-color and true-color MODIS images at Barrow, AK, the most recent image is on the right.
Background
What is Break-Up
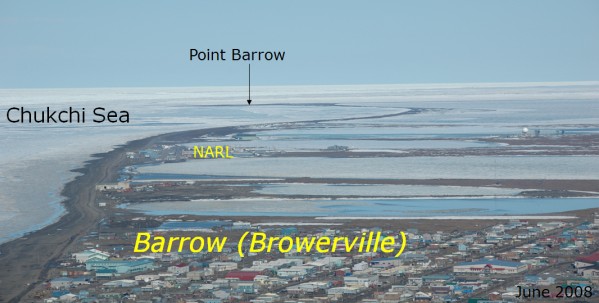
Photo of landfast ice between Barrow and Point Barrow. This forecast focuses on the ice North of the site of the Navy Arctic Research Laboratory (NARL).
We define
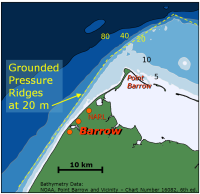
Coastal bathymetry (depth in m).
break-up as the first detected movement of landfast ice shoreward of grounded ridges within the 20 m-isobath off NARL, approximately 5 miles north of Barrow.
Typically, movement is parallel to the coast, confined by grounded pressure ridges at the 20 m-isobath. However, we exclude ice affected by dust from town and a coastal road, i.e. the first approx. 100 m off shore. Typically, we detect movement from coastal RADAR and from Satellite imagery. In previous years, webcam images near NARL were available.
Coastal bathymetry (depth in m).
Break-up Process
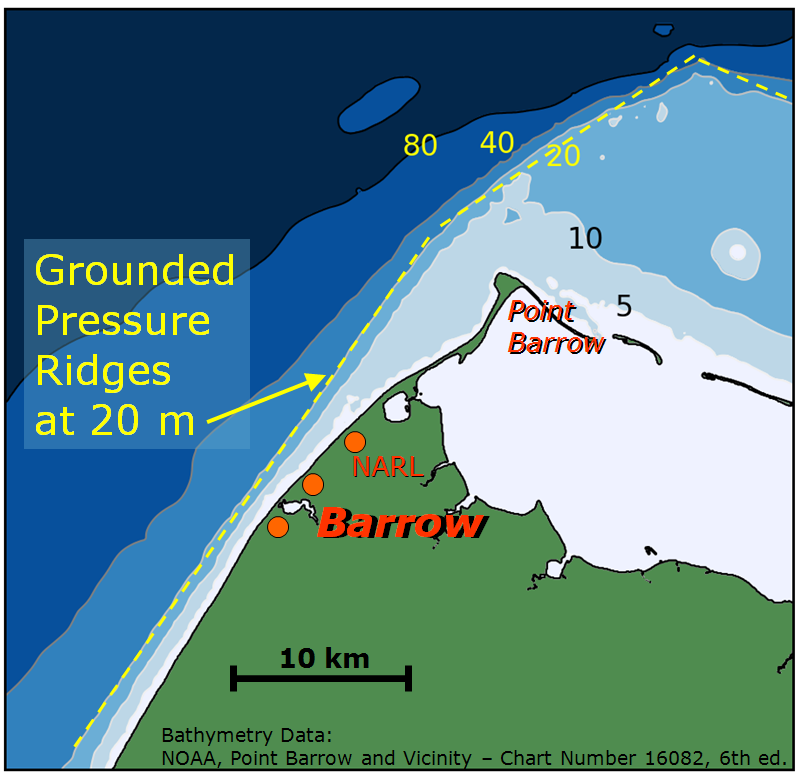
Sketch of landfast ice at the Chukchi Sea coast at Barrow, Alaska.
Break-up proceeds in two stages: Initially, ice shoreward of grounded pressure ridges begins to move collectively along the coast, followed by a period of sporadic break-out events of individual grounded ridges. After the disappearance of the snow cover in the first half of June, landfast ice closest to the shore weakens structurally due to solar heating of dirty ice and under meltponds. Eventually, regular winds are able to push the ice along shore. With reduced snow cover, more solar energy is absorbed and the oceanic heat flux to the ice increases, eroding grounded pressure ridges from below.
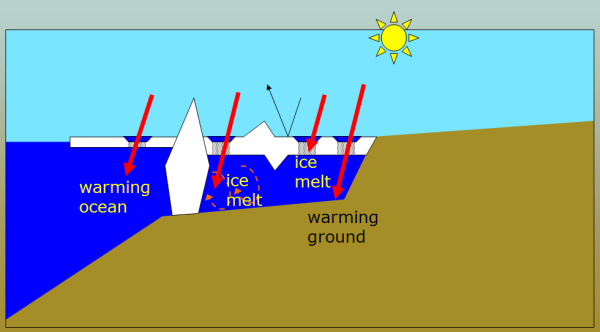
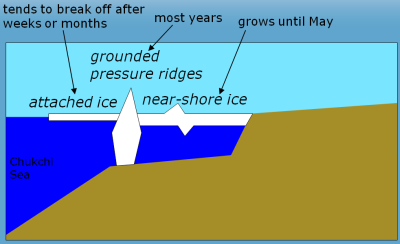
Impact of solar energy on ice melt.
Some years in the past (2002, 2003, 2004, 2007) have seen insufficient stabilization by grounded pressure ridges, leading in 2004 to the sudden disappearance of the entire coastal ice within 24 hours as early as 18 June. These cases cannot be predicted with the approach presented here. However, if grounded ridges are present, break-up should take place in the first half of July, with some grounded ridges possibly persisting into early August.
Break-up in Recent Years
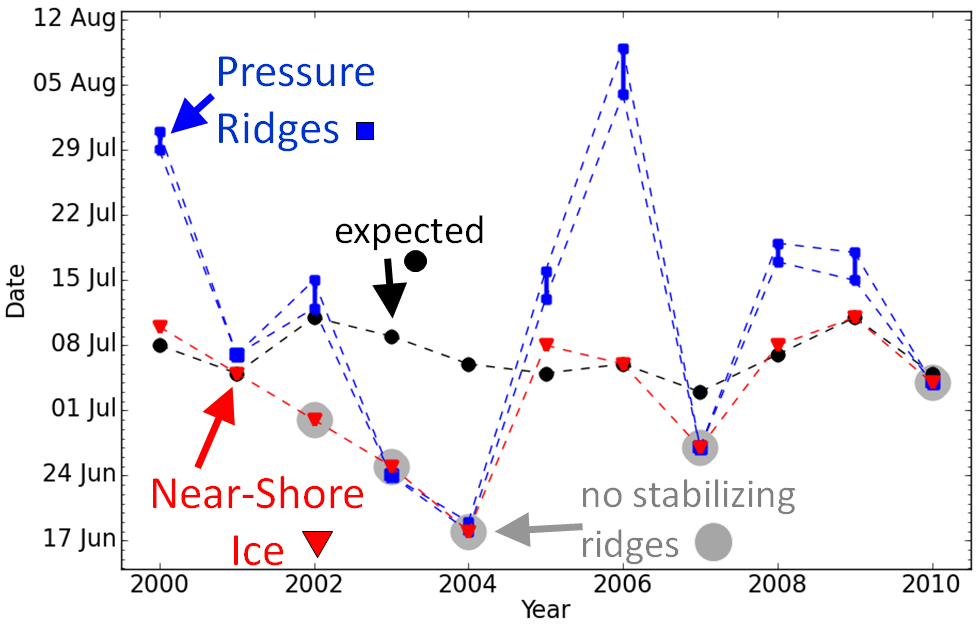
Break-up in previous years.
In the recent past, two modes of break-up were observed: break-up of near-shore ice in the presence of stabilizing, grounded pressure ridges, and break-up without stabilizing pressure ridges (2002, 2003, 2004, 2007, indicated as big gray discs in the figure above). In years with stabilizing pressure ridges, near-shore ice started to move (red triangles) considerably earlier than grounded pressure ridges (blue squares). In these years, the expected date of ice break-up (black dots) coincides with the observed movement of near-shore ice. In 2002, grounded pressure ridges did not appear until several months after the near-shore ice formed, and they formed beyond the reaches of the near-shore ice. Hence, break-up of near-shore ice took place without the stabilizing effect of grounded pressure ridges. (See the 2009 break-up page for details on how break-up progressed during the past 10 years.)
Publications
Publications:
- Petrich, C., H. Eicken, J. Zhang, J. R. Krieger, Y. Fukamachi, and K. I. Ohshima (in press) Coastal landfast sea ice decay and break-up in northern Alaska: Key processes and seasonal prediction, Journal of Geophysical Research, doi: 10.1029/2011JC007339. (pdf)
- Chris Petrich, Hajo Eicken, Mette Kaufman, and Don Perovich (2009) Integrating input from local, indigenous ice experts, a coastal ice observatory and measurements of ice decay into a forecast of coastal ice break-up. Poster presented at the Arctic Observing Network (AON) PI Meeting, 30 November–2 December 2009 in Boulder, CO, and at the International Glaciological Society (IGS) International Symposium on Sea Ice in the Physical and Biogeochemical System, 31 May–4 June 2010, in Tromsø, Norway. (pdf)
- Chris Petrich, Hajo Eicken, Jing Zhang, and Jeremy Krieger (2009) Forecasting coastal ice decay and break-up in northern Alaska. Presentation at the 2009 Fall Meeting of the American Geophysical Union (AGU) in San Francisco, CA, 14–18 December, 2009.
Acknowledgements
The 2011 break-up forecast was supported by the National Science
Foundation (NSF). Any opinions, findings and conclusions or recommendations
expressed in this material are those of the author(s) and do not necessarily
reflect the views of the National Science Foundation.
Data were obtained from the Atmospheric Radiation Measurement (ARM) Program sponsored by the U.S. Department of Energy, Office of Science, Office of Biological and Environmental Research, Environmental Sciences Division.
Figures provided on this page are courtesy Chris Petrich.
Data were obtained from the Atmospheric Radiation Measurement (ARM) Program sponsored by the U.S. Department of Energy, Office of Science, Office of Biological and Environmental Research, Environmental Sciences Division.
Figures provided on this page are courtesy Chris Petrich.
Contact: Chris Petrich,
chris.petrich@gi.alaska.edu