| Sea Ice Group at the Geophysical Institute |

|
|
This page reports on a past ice season.
See http://seaice.alaska.edu/gi/observatories/barrow_sealevel
for 2010 data.
Barrow Sea Ice Mass Balance Site 2009
Results below from equipment on first-year, landfast sea ice (71.36655° N, 156.54140° W) offshore of Niksiuraq, the hook at the end of the road to Point Barrow. Measurements are taken every 15 minutes. The latest recorded measurements available are:
| Jun 13, 2009, 02:15 PM AKDT | Air Temperature: -11°C, 12°F |
Ice Thickness: 0.94 m, 3ft 1" |
Plots are generated from automatically processed data prior to human quality control.
This is an archived page. The mass balance probe was recovered from the ice on June 12.
Data quality is not assured starting June 3 due to movement of the instruments in melting ice. The following measurements have known systematic errors:water depth reported is too shallow; ice thickness reported is too thin; snow cover reported is too thick.
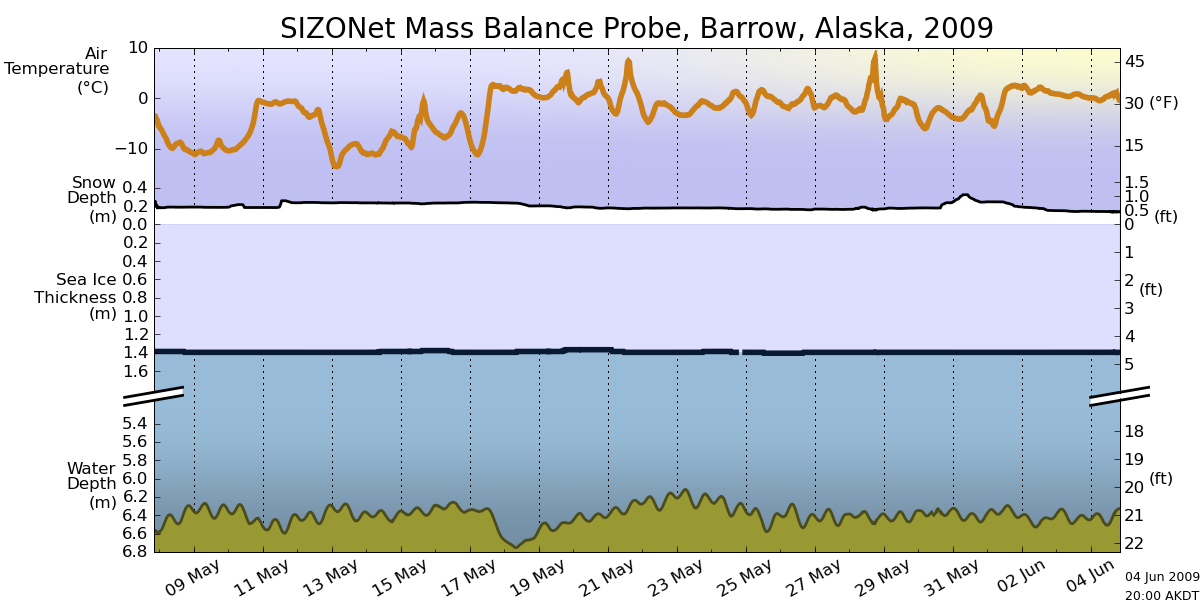  |
Air temperature, snow depth, sea ice thickness, and water depthThis plot shows the air temperature, snow depth, ice thickness and water depth measured at the mast at the Mass Balance Site (see figure below). Snow depth and ice thickness are derived from acoustic sounders that take one measurement every 15 minutes. The accuracy is about ±1 cm (±1/2 inch). Data are filtered for this plot; unfiltered data are shown below. We had a curious bear visiting the probe around noon on Feb 11 that left the probe slightly distorted (snow depth pinger higher, air thermometer lower). The snow depth is corrected for this Related resources: ARM facility, taking meteorological and radiation measurements; NOAA Barrow weather conditions; NOAA tide predictions for Point Barrow. |
 |
Temperature ProfileThis is the temperature profile through air, snow, ice, and water. The grayed area indicates the position of the ice (bottom may be off by 0.1 m). The bounds of the red funnel are the highest and lowest temperatures recorded during the past 24 hours. The black line with data points (spaced 0.1 m, 4 inches) is the latest temperature profile. Air, snow, ice, and water can often be discriminated easily in winter and early spring: daily temperature swings are more pronounced in the air than in the snow; the temperature profile in the ice is usually linear and steeper than in the snow; the temperature in the water is approximately independent of depth. Towards summer the ice acts as a heat sink with the coldest temperature registered inside the ice rather than in the air. Temperature measurements are accurate to approx. ±0.2 °C. Further, measurements in summer may be affected by solar heating of the probe. The probe was removed from the ice on June 12, 2009. |
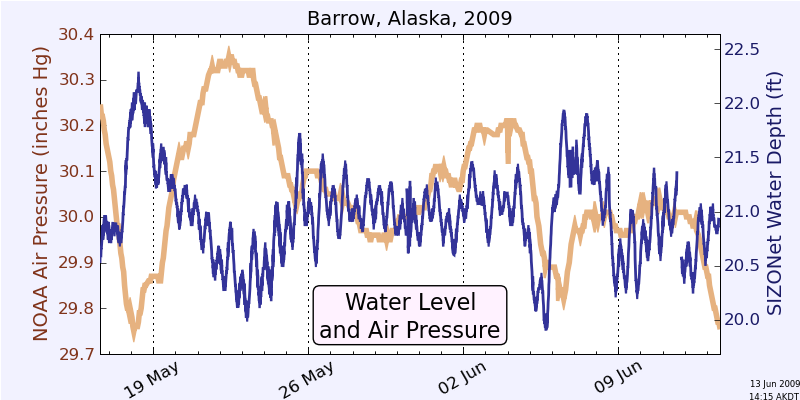  |
Sealevel and Air PressureThese figures shows the water depth underneath the Mass Balance Probe and NOAA air pressure measurements at the Barrow airport. Both tides and air pressure variations contribute to the water depth variations. In the long-term plot, the water depth measurements are filtered to remove the tidal signal. These figures are updated every 8 hours. Related resources: NOAA Barrow Weather observations. |
 |
Equipment and MeasurementsThe 2009 Mass Balance Site consists of the following sensors:
Data flow:
Meta data file for 2009: BRW09_MBS_metadata.txt |
Supplementary plots

 |
Air temperature, snow depth, sea ice thickness, and water depthThis plot shows the air temperature, snow depth (two locations), ice thickness and water depth measured at the mast at the Mass Balance Site (see figure above). Snow depth and ice thickness are derived from acoustic sounders that take one measurement every 15 minutes. The accuracy is about ±1 cm (±1/2 inch). The colored lines are snow depth and ice thickness data smoothed by a median filter with a 24-hour window. The actual measurements are shown in light gray underneath. Snow depth and ice thickness are spot measurements rather than aerial averages. There are snow dunes on the ice that may be 60 cm (2 ft) deeper than the thinnest snow; the measurements by the pingers are probably somewhere between the extremes. Similarly, the thickness of level ice varies in the general area surrounding the Mass Balance Probe. Related resources: ARM facility, taking meteorological and radiation measurements; NOAA Barrow weather conditions. |
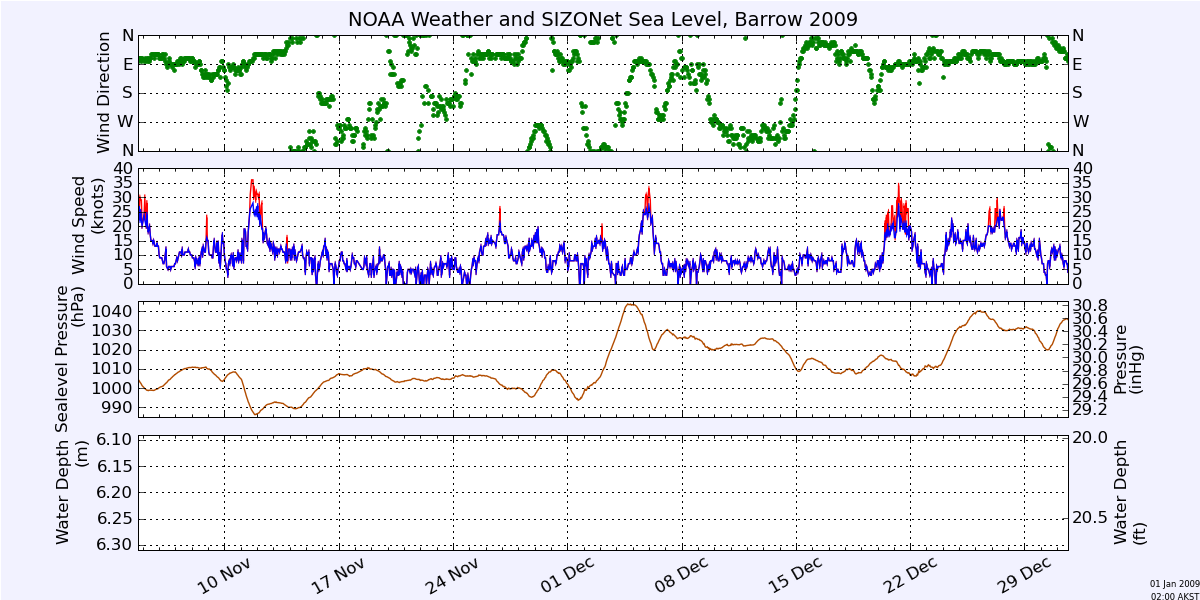 |
Air Pressure, Wind, and SealevelHere are the main factors that play into the variation of the sea level (besides tides). Wind speed, direction, and sealevel pressure are hourly NOAA measurements at the Barrow airport. Sealevel is from the mass balance probe. Related resources: NOAA Barrow weather conditions, |
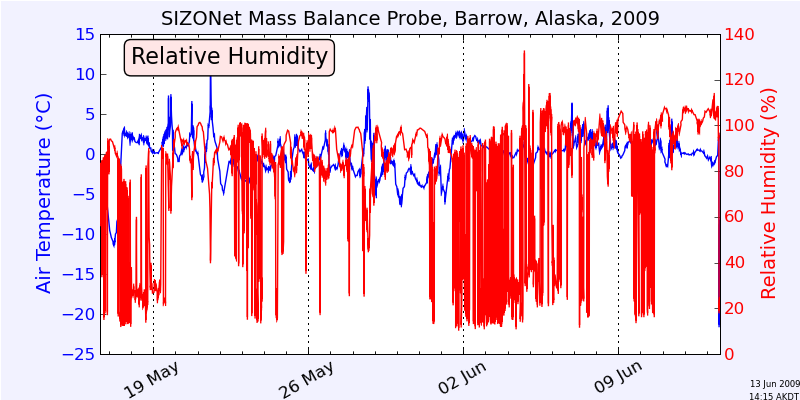 |
Relative HumidityThese are air temperature and relative humidity, both measured by the Campbell CS500 probe enclosed in a radiation shield on the pinger mast. The crystal measuring relative humidity appears to be defective. Related resources: ARM facility, taking meteorological and radiation measurements; NOAA Barrow weather conditions. |
 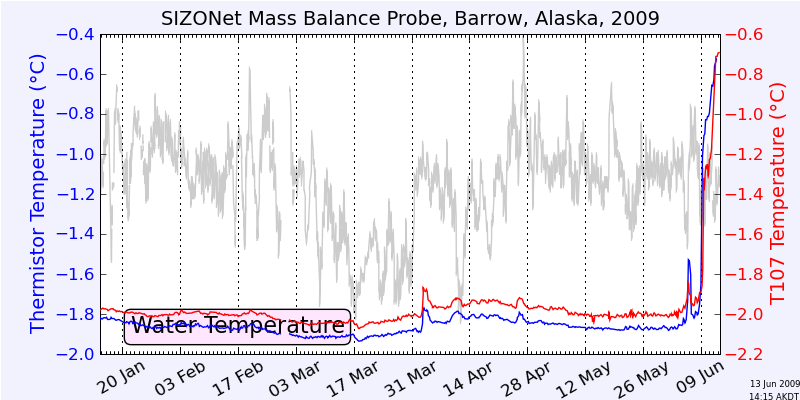 |
Water TemperatureThis figure shows the water temperature approx. 1 to 2 m below the ice as detected by the bottom-most thermistor of the string of temperature sensor, and by the Campbell T107 thermistor probe mounted next to the underwater sounders. Data are smoothed by a running average filter with 6 hour window. The temperature readings are only crudely calibrated to ±0.2 °C. Note that both thermistor readings are prone to drift and sudden jumps equivalent to <0.1 °C. In addition, both sensors are heated by solar radiation. The line in light gray is the tidal signal. The peak around June 6 is probably due to release of meltwater from a coastal lake. The temperature rise starting June 9 is probably due to melt-out of the temperature probe and surface meltwater drainage through the resulting hole. |
Technical Support
Here are data that are probably most interesting for the administration of the Mass Balance Site.
 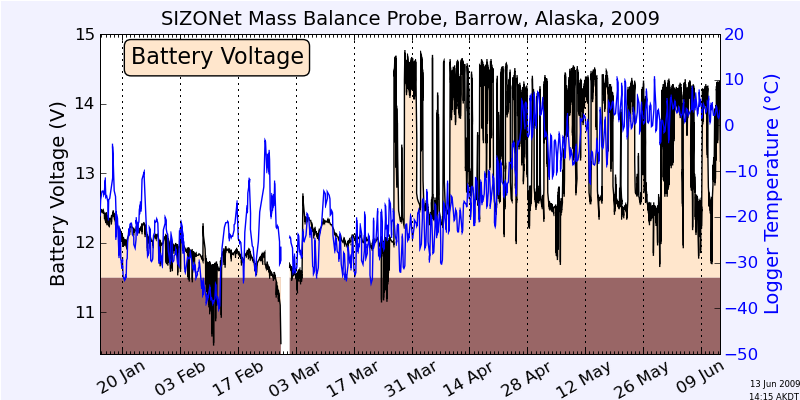 |
The Mass Balance Site is powered by two lead acid batteries. Their voltage can be used to estimate the available charge. A voltage of 10.5 V is typical for a completely drained lead acid battery. This is higher than the minimum voltage required for the data logger (9.6 V) and for the RF radio (6 V). At 11.5 V the batteries are still up to 10% charged, but the freezing point of the battery is typically quite high (around –20 °C or 0 °F). We aim to keep the battery voltage above 11.5 V at all times. The batteries are charged by an Aero4Gen wind turbine since March 26. The charge voltage increases with wind speed but is capped by a temperature-compensated charge controller. Related resources: NOAA Barrow weather conditions. |
Contact: chris.petrich@gi.alaska.edu
Acknowledgements
This project is supported through the Alaska Ocean Observing System (AOOS) with logistical and technical support provided by the Barrow Arctic Science Consortium (BASC). We also gratefully acknowledge the Arctic Slope Regional Corporation (ASRC) for supporting installation of the webcam and radar. This material is also based upon work supported by the National Science Foundation under Grant No. OPP-0632398. Any opinions, findings and conclusions or recommendations expressed in this material are those of the author(s) and do not necessarily reflect the views of the National Science Foundation (NSF).
NCEP Reanalysis data provided by the NOAA/OAR/ESRL PSD, Boulder, Colorado, USA, from their Web site at http://www.cdc.noaa.gov/