
2011 Sea Ice Break-Up Forecast
for Barrow, Alaska
for Barrow, Alaska
2011 break-up has occurred.
Break-up at UIC-NARL occurred probably around 3 or 4 July 2011 when the
near-shore ice started to drift South.
Early melt pond development along the Chukchi Sea coast and
a large sediment load of the ice may have contributed to the timing of
disintegration of the landfast ice this year. Few bits of ice
were left drifting along the Barrow coast to the South in the evening of 4 July.
While the near-shore section of landfast ice at UIC-NARL was gone
by 4 July, a substantial amount of grounded ice persisted
1/2 mile offshore.
Also, grounded pressure ridges that formed at UIC-NARL close to the shore
during the
February ice shove
were still in place on 4 July.
Almost all of the grounded ice broke out on 6 July.
This is a summary
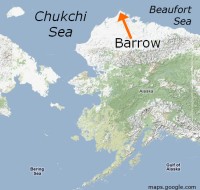
Location of Barrow
of the break-up forecast for landfast ice at the Chukchi Sea coast at Barrow, Alaska.
In typical years, the timing of break-up is associated with the amount of incoming solar energy
(i.e., essentially, how sunny or cloudy it is).
In order to predict break-up, we use a combination of data, covering

Location of Barrow
- Future Conditions: a 16-day NOAA/NCEP GFS-based WRF weather forecast (Zhang and Krieger),
- Current Conditions: NOAA aviation weather observations, and
- Recent Conditions: measurements provided by the Department of Energy Atmospheric Radiation Measurement program (ARM).
Latest Forecast
Break-up Forecast
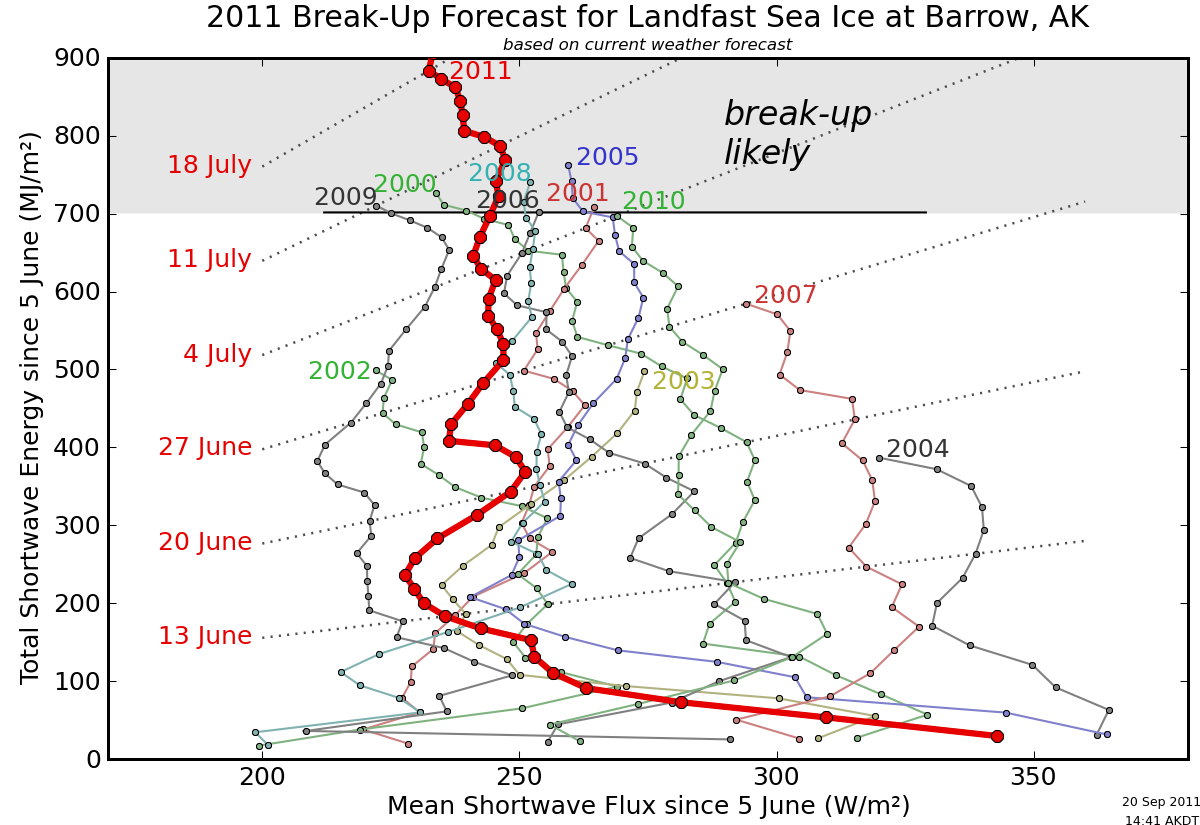
This year's melt progress compared with previous years. Lines end on the day of observed break-up.
Last forecast for break-up:
on July 8
(forecast history)
In years with significantly grounded pressure ridges, level and rubble landfast sea ice close to the shore will break up as a result of input of solar energy that leads to structural weakening and disintegration into individual floes. In the figure above, the accumulated incoming solar shortwave energy is used as an indicator for the time this break-up occurs. The start date of June 5 is chosen as it is typical the beginning of meltpond formation. In 2002, 2003, 2004, and 2007, ice broke out in the absence of grounded pressure ridges, which cannot be predicted with this approach.
The figure above contains the expectation based on the 16-day extended weather forecast (dark red line, end point labeled 2011???), and, after June 5, this year's path already taken (bright red, end point labeled 2011).
Observations 2011
Current Ice Conditions
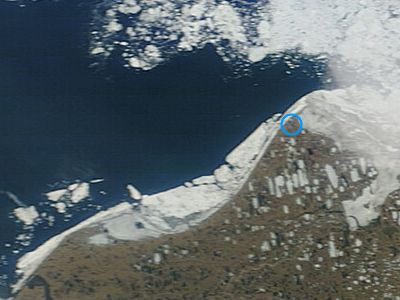
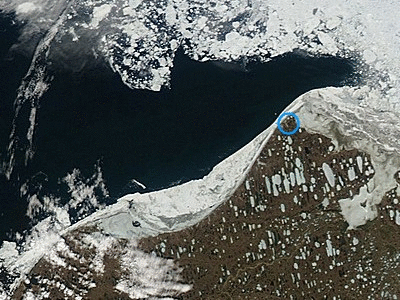
Here are regional ice conditions from crops of the
NASA/GSFC, Rapid Response
Arctic MODIS mosaic
of the last five days. The false-color images (bands 3-6-7) show snow and ice as red, vegetation green, and clouds white,
see Rapid Response FAQ for details. The upper two rows are from satellite Terra, the bottom row is from Aqua. Image area is approximately 50 km x 50 km (30 mi x 30 mi).
In addition, the following services provide access to projected images of the most recent and archived satellite data in the Barrow region:
GINA Swath Viewer (optical sensors) and
BAID-IMS Barrow SAR Viewer (RADAR).


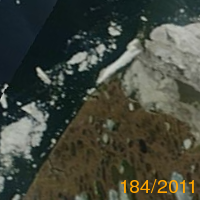


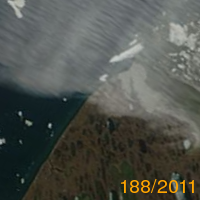


False-color and true-color MODIS images at Barrow, AK, the most recent image is on the right.
Notable Events
- 6 July 2011: Break-out of most of the remaining pressure ridges.
- 3/4 July 2011: Clearing of the near-shore section of landfast ice at UIC-NARL (break-up).
- 2/3 July 2011: Break-out of ice right at downtown Barrow, and of ice seaward of pressure ridges between Barrow and Point Barrow.
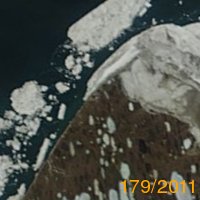

Terra MODIS of 28 June and 3 July 2011. - 27 June 2011: Much of the landfast ice broke off at once between downtown Barrow and Point Franklin (100 km, 60 mi SW of Barrow).
Barrow resident Jason Herreman, Department of Wildlife Management of the North Slope Borough: "Between 2 and 5 [pm] today the pack ice and shorefast ice from Barrow playground/bank building and everything South started heading north at about 2 knots. The only ice not moving in that area are some large grounded pressure ridges. The shorefast ice north of Barrow proper does not appear to be moving at present."
While this event is highly significant for the Barrow community, this is not the break-up we are looking for on this page.
A storm tide may have occurred South of Barrow on the 27th, helping to dislodge landfast ice. A rise of water level generated by a storm was predicted by the NOAA surge prediction model, ET-SURGE (see plot from their web page). While the magnitude of the predicted surge is small, output from ET-SURGE has not been verified against measurements at Barrow.


Snow Conditions
Snow melt leads to the formation of melt ponds. While we do not have
real-time measurements of snow melt on sea ice, the Department of Energy
Atmospheric Radiation Measurement (ARM) program provides surface albedo
(i.e. reflectivity) measurements on the tundra at Barrow.
These data are made available with 1 to 5 days delay.
In the past, snow melt on the tundra appeared to have been a crude
indicator for snow melt on sea ice North of NARL.
Snow tends to melt earlier at downtown Barrow due to dust deposited
from the road
(note that the webcam shows ice conditions at downtown Barrow).
With reference to the figure below,
in 2002 melt ponds started to form as early as May,
but this was followed by a cold spell and snow fall that delayed
the complete removal of snow. In 2010, snow was particularly deep
both on the tundra and on sea ice, and melt ponds on sea ice started
to form a few days later than in previous years.
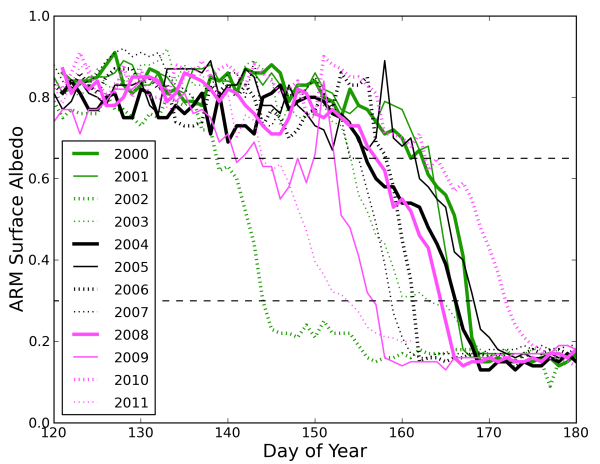
Tundra albedo measurements of previous years.
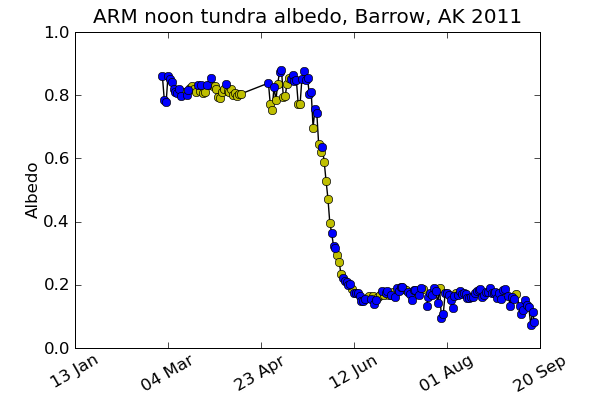
Recent tundra albedo measurements at Barrow, 2011. Yellow dots indicate days of relatively clear skies.
Background
What is Break-Up
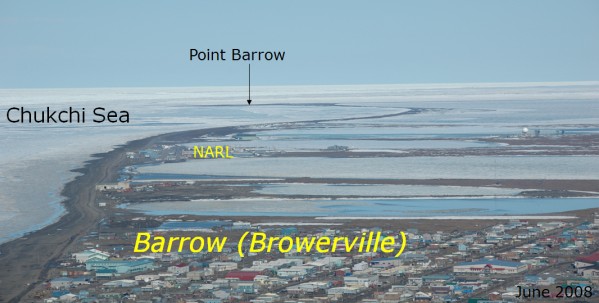
Photo of landfast ice between Barrow and Point Barrow. This forecast focuses on the ice North of the site of the Navy Arctic Research Laboratory (NARL).
We define
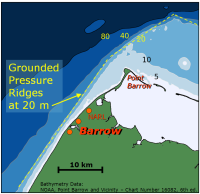
Coastal bathymetry (depth in m).
break-up as the first detected movement of landfast ice shoreward of grounded ridges within the 20 m-isobath off NARL, approximately 5 miles north of Barrow.
Typically, movement is parallel to the coast, confined by grounded pressure ridges at the 20 m-isobath. However, we exclude ice affected by dust from town and a coastal road, i.e. the first approx. 100 m off shore. Typically, we detect movement from coastal RADAR and from Satellite imagery. In previous years, webcam images near NARL were available.
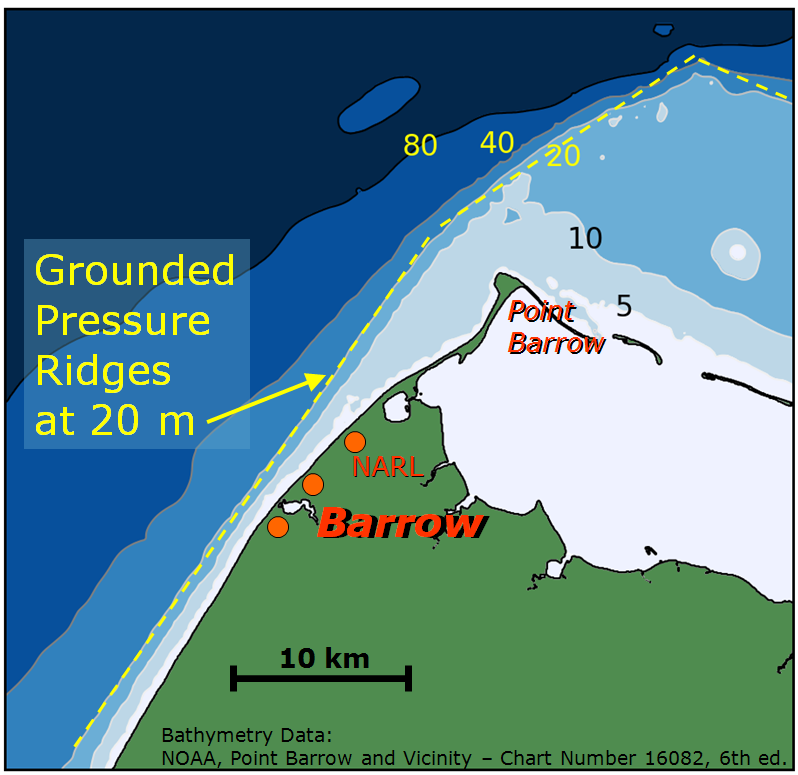
Coastal bathymetry (depth in m).
Break-up Process
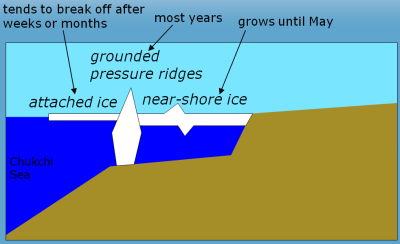
Sketch of landfast ice at the Chukchi Sea coast at Barrow, Alaska.
Break-up proceeds in two stages: Initially, ice shoreward of grounded pressure ridges begins to move collectively along the coast, followed by a period of sporadic break-out events of individual grounded ridges. After the disappearance of the snow cover in the first half of June, landfast ice closest to the shore weakens structurally due to solar heating of dirty ice and under meltponds. Eventually, regular winds are able to push the ice along shore. With reduced snow cover, more solar energy is absorbed and the oceanic heat flux to the ice increases, eroding grounded pressure ridges from below.
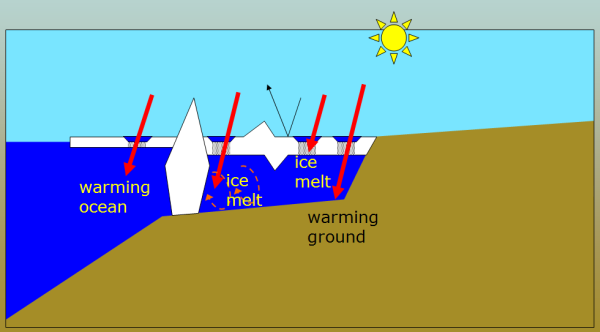
Impact of solar energy on ice melt.
Some years in the past (2002, 2003, 2004, 2007) have seen insufficient stabilization by grounded pressure ridges, leading in 2004 to the sudden disappearance of the entire coastal ice within 24 hours as early as 18 June. These cases cannot be predicted with the approach presented here. However, if grounded ridges are present, break-up should take place in the first half of July, with some grounded ridges possibly persisting into early August.
Break-up in Recent Years

Break-up in previous years.
In the recent past, two modes of break-up were observed: break-up of near-shore ice in the presence of stabilizing, grounded pressure ridges, and break-up without stabilizing pressure ridges (2002, 2003, 2004, 2007, indicated as big gray discs in the figure above). In years with stabilizing pressure ridges, near-shore ice started to move (red triangles) considerably earlier than grounded pressure ridges (blue squares). In these years, the expected date of ice break-up (black dots) coincides with the observed movement of near-shore ice. In 2002, grounded pressure ridges did not appear until several months after the near-shore ice formed, and they formed beyond the reaches of the near-shore ice. Hence, break-up of near-shore ice took place without the stabilizing effect of grounded pressure ridges. (See the 2009 break-up page for details on how break-up progressed during the past 10 years.)
Ice Conditions 2011
This year,
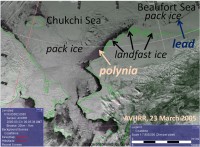
Coastal polynia
near-shore ice at Barrow comprises mostly of rubble ice that drifted to the shore from the Beaufort Sea in November.
Small patches of level, undeformed ice exist in-between deformed ice. While the level ice contains only little sediment,
most of the rubble ice is sediment-laden (i.e. it looks dirty).
This ice is sheltered by pressure ridges at the 20 m-isobath (approx. 0.5 to 5 km off shore).

Coastal polynia
Publications
Publications:
- Petrich, C., H. Eicken, J. Zhang, J. R. Krieger, Y. Fukamachi, and K. I. Ohshima (in press) Coastal landfast sea ice decay and break-up in northern Alaska: Key processes and seasonal prediction, Journal of Geophysical Research, doi: 10.1029/2011JC007339. (pdf)
- Chris Petrich, Hajo Eicken, Mette Kaufman, and Don Perovich (2009) Integrating input from local, indigenous ice experts, a coastal ice observatory and measurements of ice decay into a forecast of coastal ice break-up. Poster presented at the Arctic Observing Network (AON) PI Meeting, 30 November–2 December 2009 in Boulder, CO, and at the International Glaciological Society (IGS) International Symposium on Sea Ice in the Physical and Biogeochemical System, 31 May–4 June 2010, in Tromsø, Norway. (pdf)
- Chris Petrich, Hajo Eicken, Jing Zhang, and Jeremy Krieger (2009) Forecasting coastal ice decay and break-up in northern Alaska. Presentation at the 2009 Fall Meeting of the American Geophysical Union (AGU) in San Francisco, CA, 14–18 December, 2009.
Acknowledgements
The 2011 break-up forecast is supported by the National Science
Foundation (NSF). Any opinions, findings and conclusions or recommendations
expressed in this material are those of the author(s) and do not necessarily
reflect the views of the National Science Foundation.
Data were obtained from the Atmospheric Radiation Measurement (ARM) Program sponsored by the U.S. Department of Energy, Office of Science, Office of Biological and Environmental Research, Environmental Sciences Division.
Figures provided on this page are courtesy Chris Petrich.
Data were obtained from the Atmospheric Radiation Measurement (ARM) Program sponsored by the U.S. Department of Energy, Office of Science, Office of Biological and Environmental Research, Environmental Sciences Division.
Figures provided on this page are courtesy Chris Petrich.
Contact: Chris Petrich,
chris.petrich@gi.alaska.edu