| Sea Ice Group at the Geophysical Institute |

|
|
Barrow Sea Ice Break-Up Outlook 2009
Barrow Sea Ice Break-up in the News

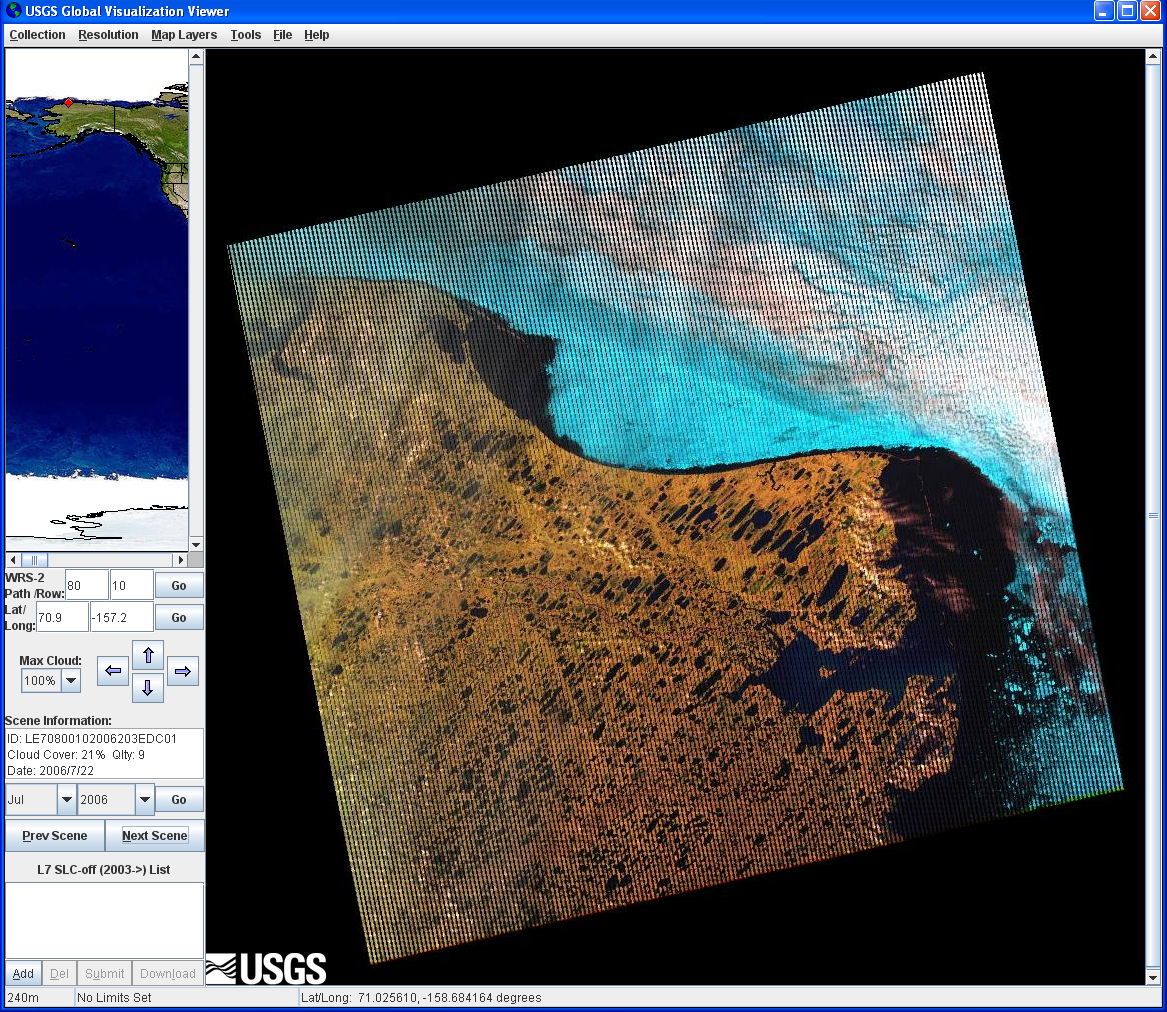
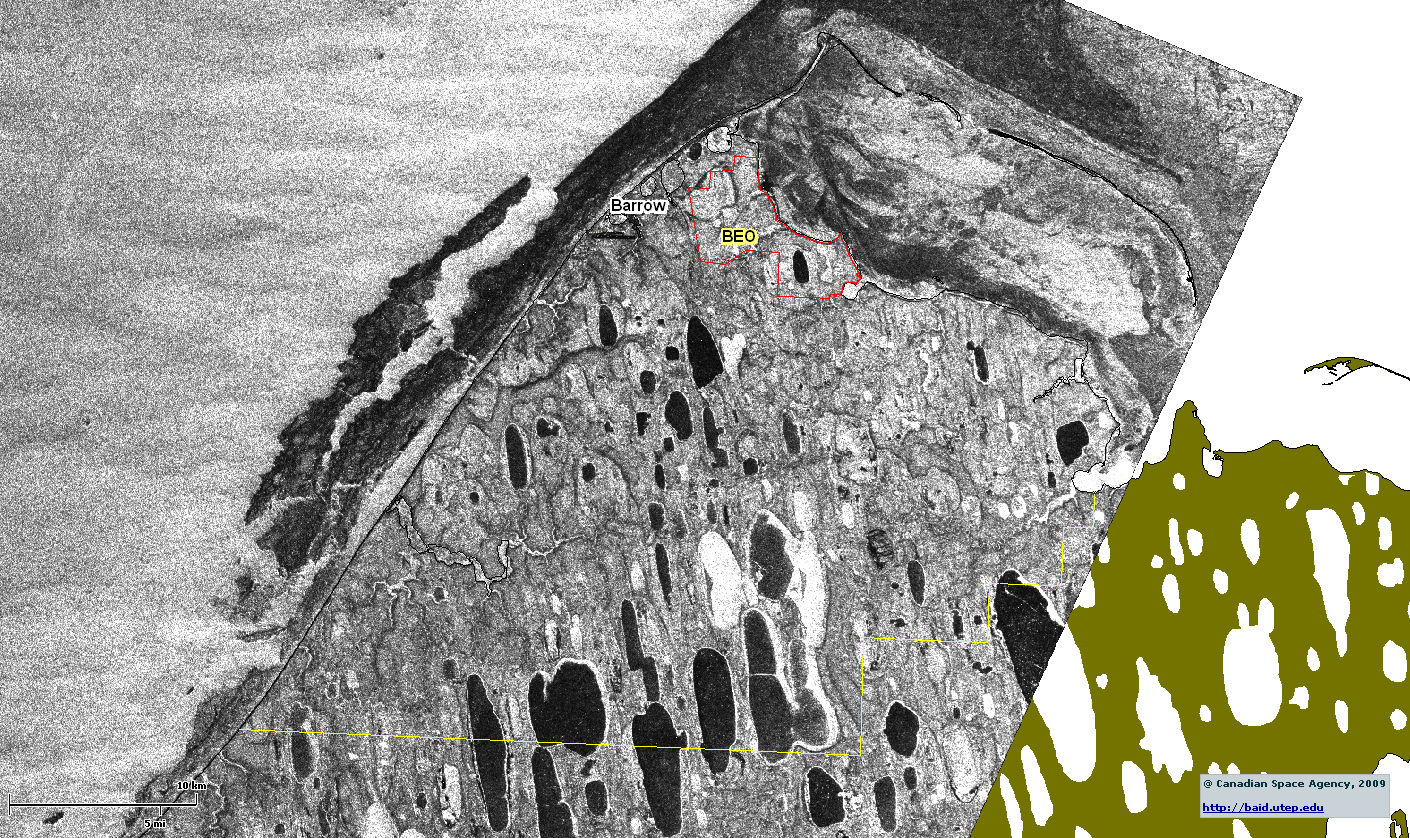
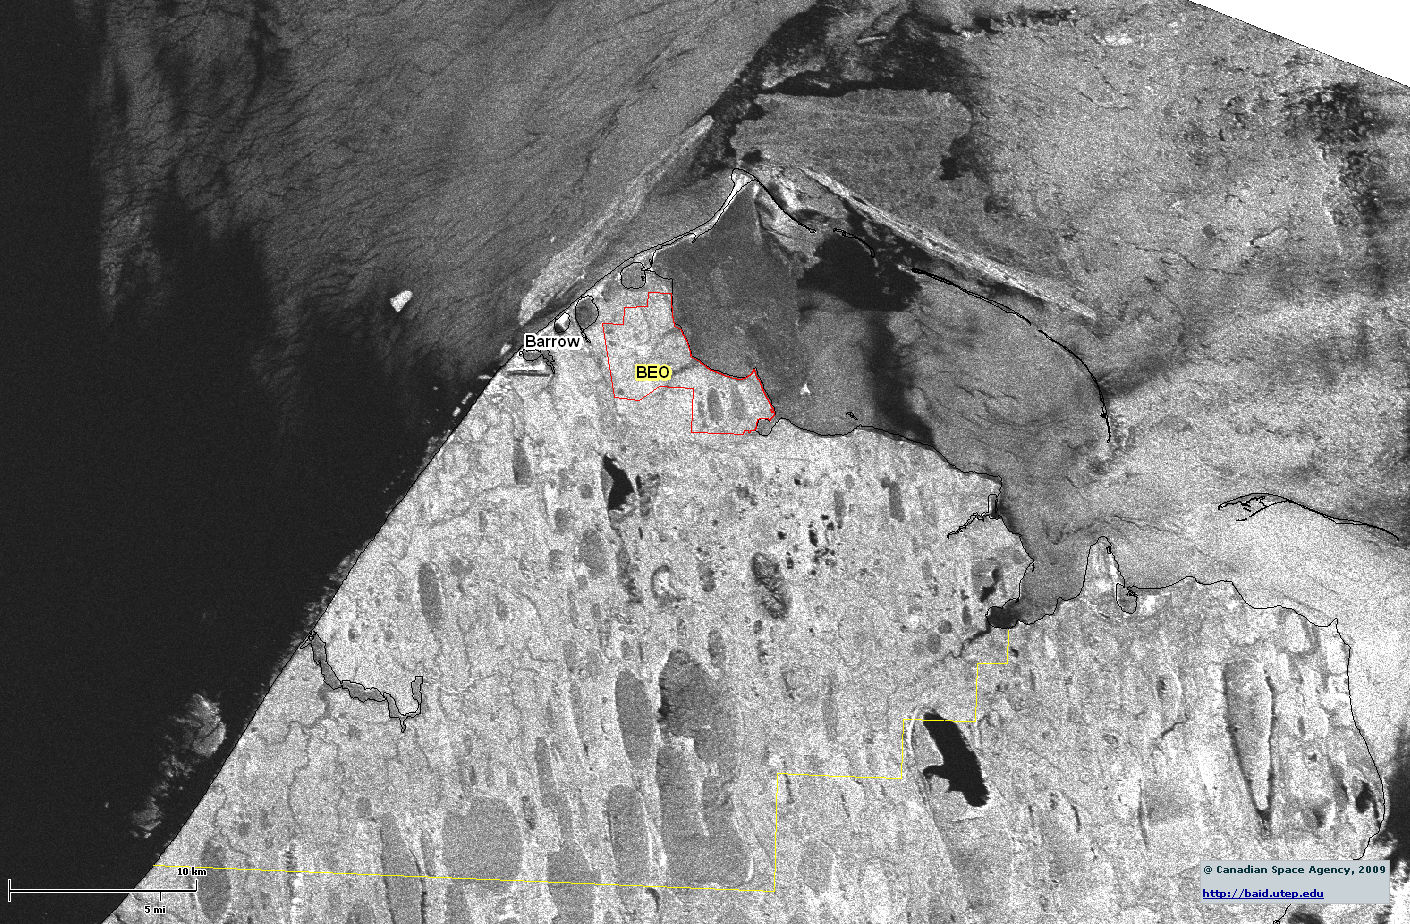
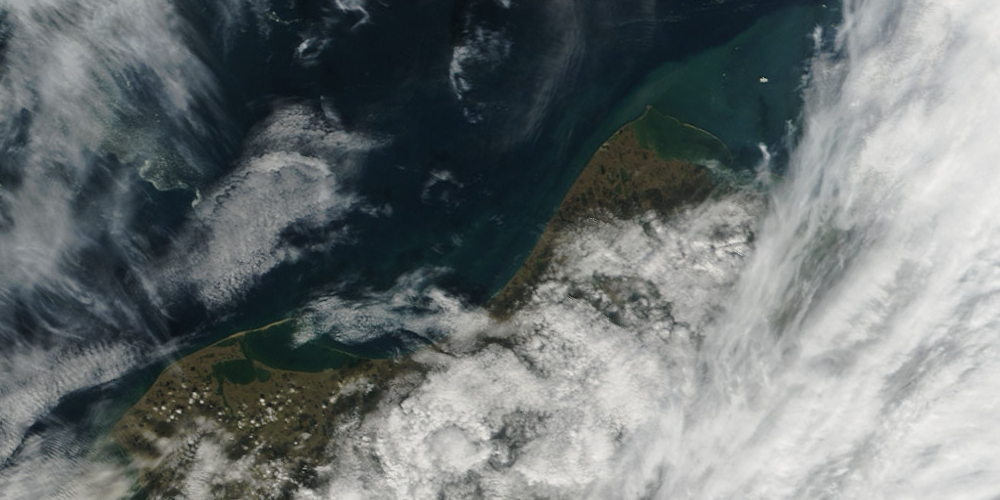
USGS Barrow sea ice poster
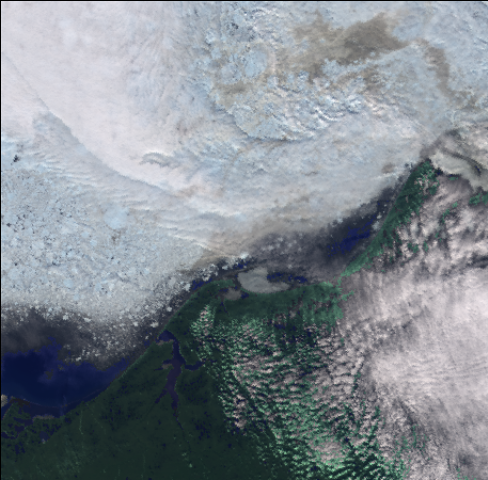
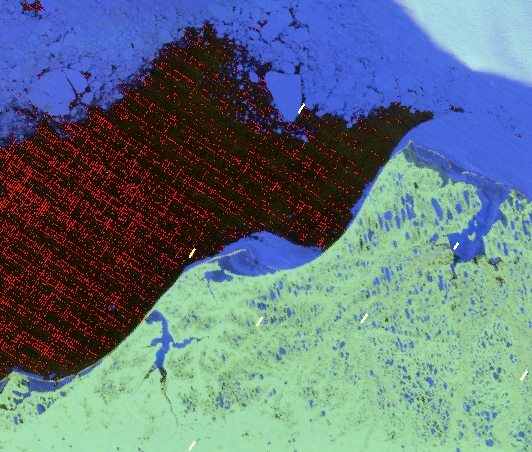
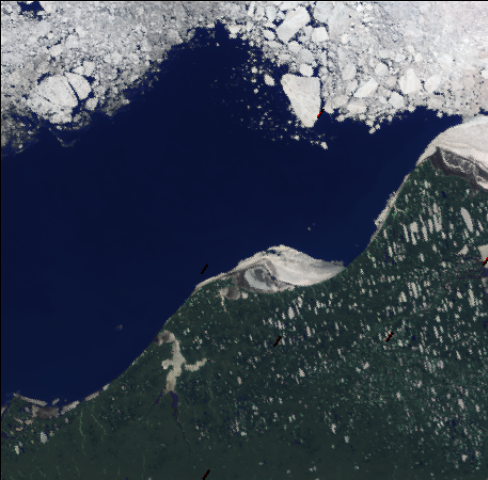
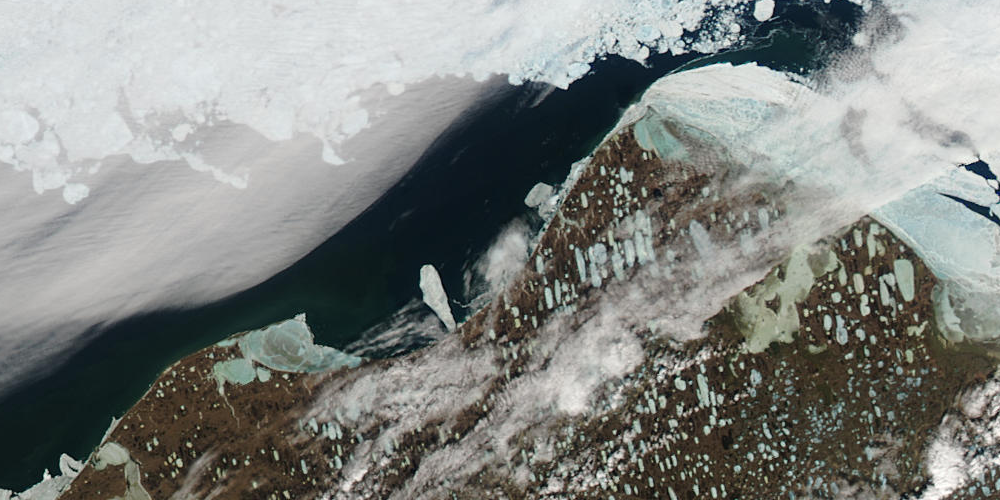
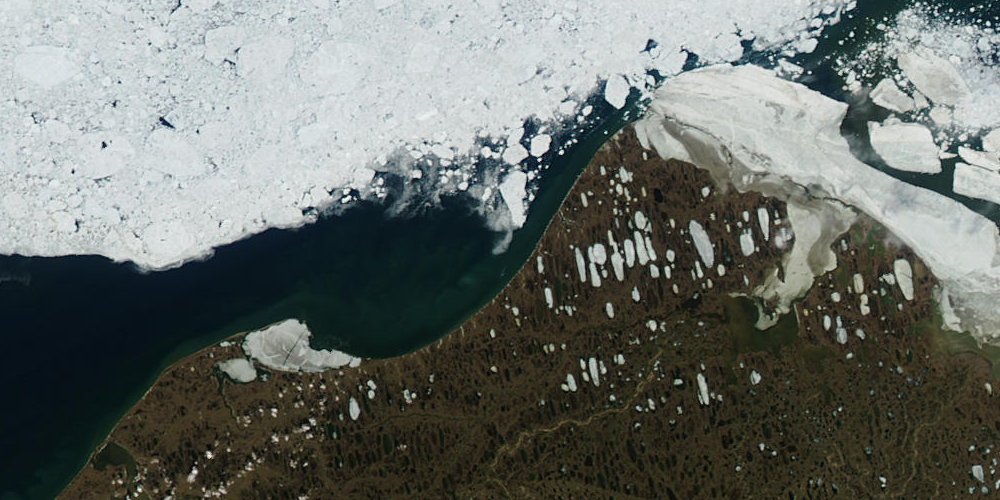
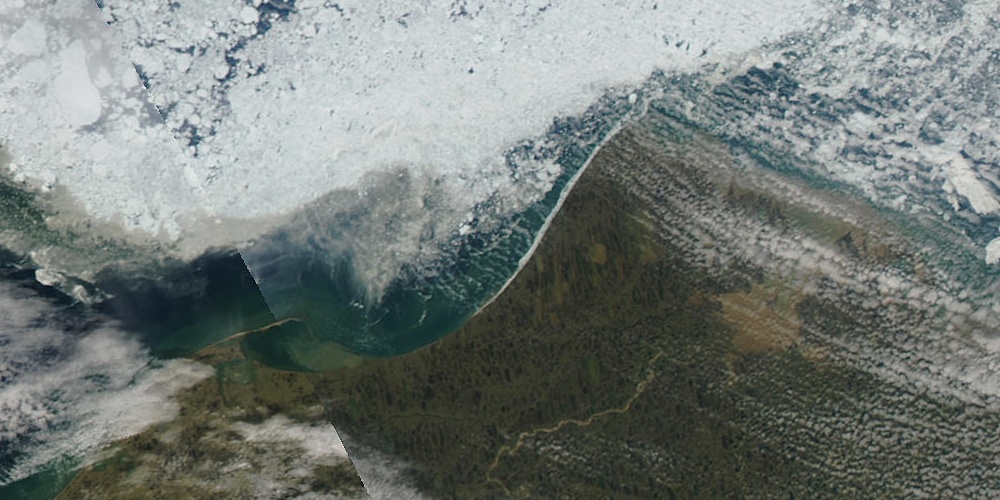
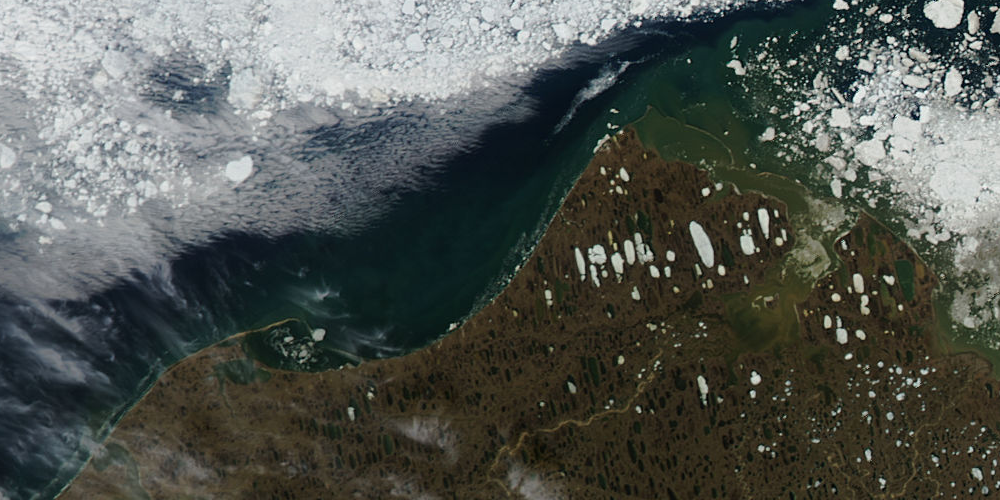
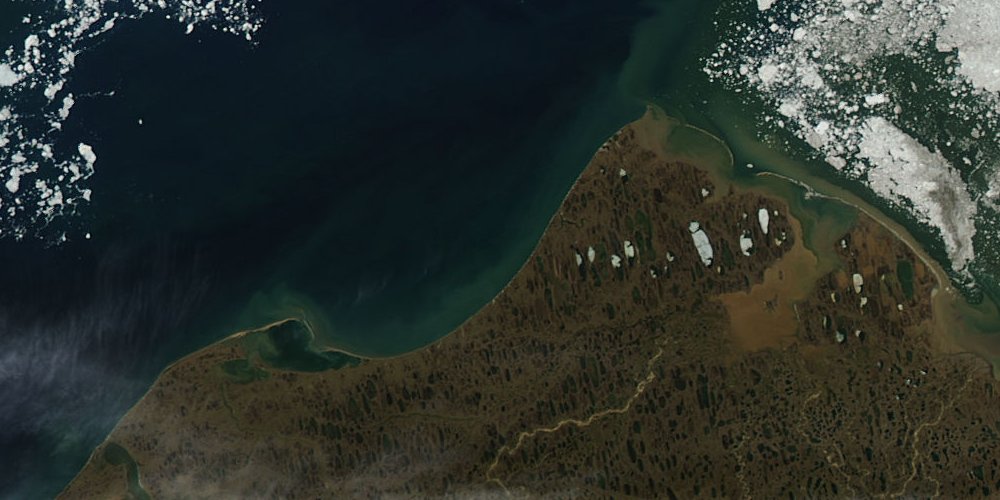
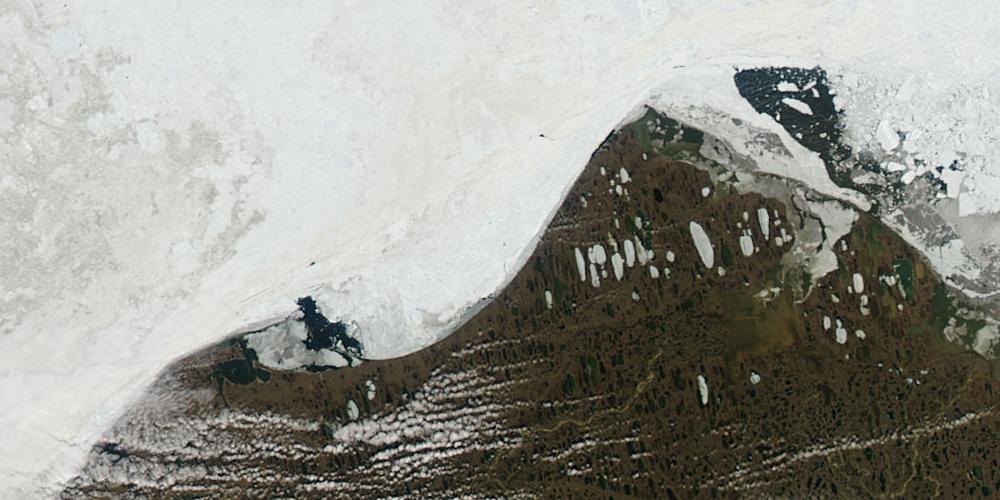
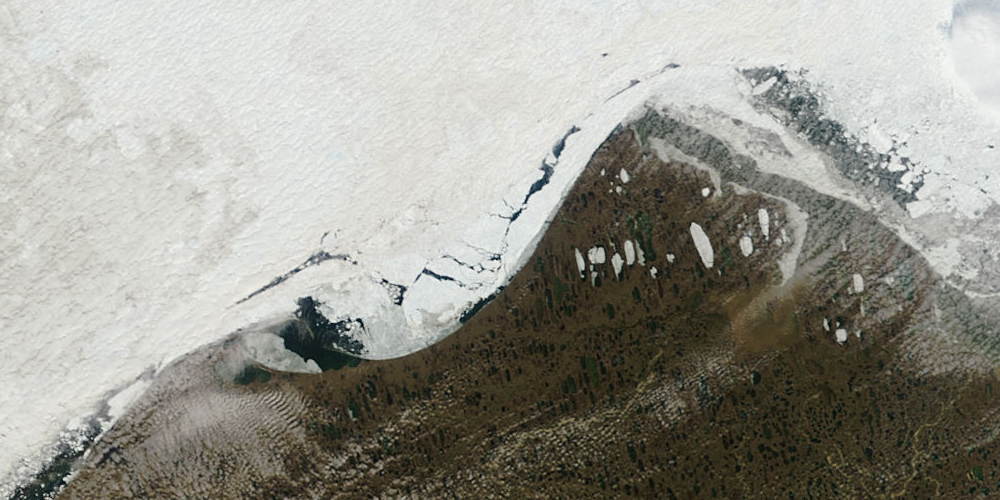
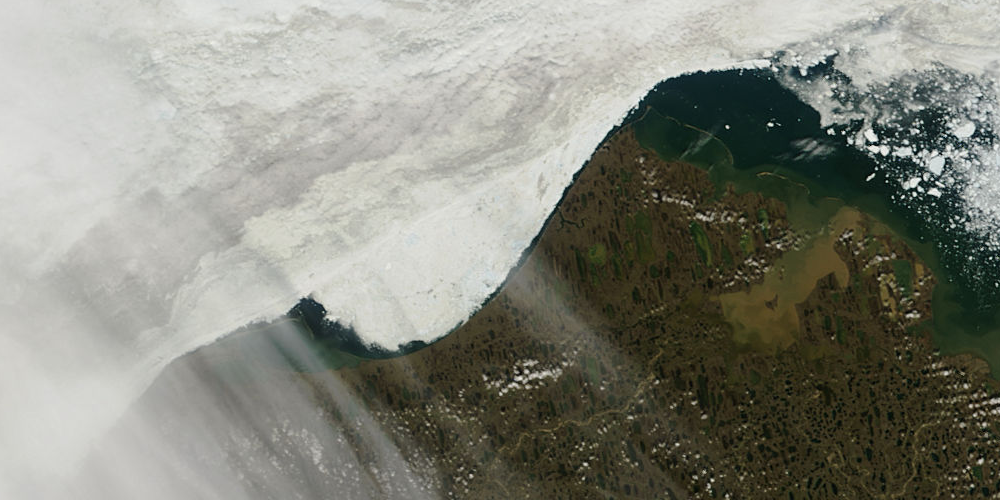
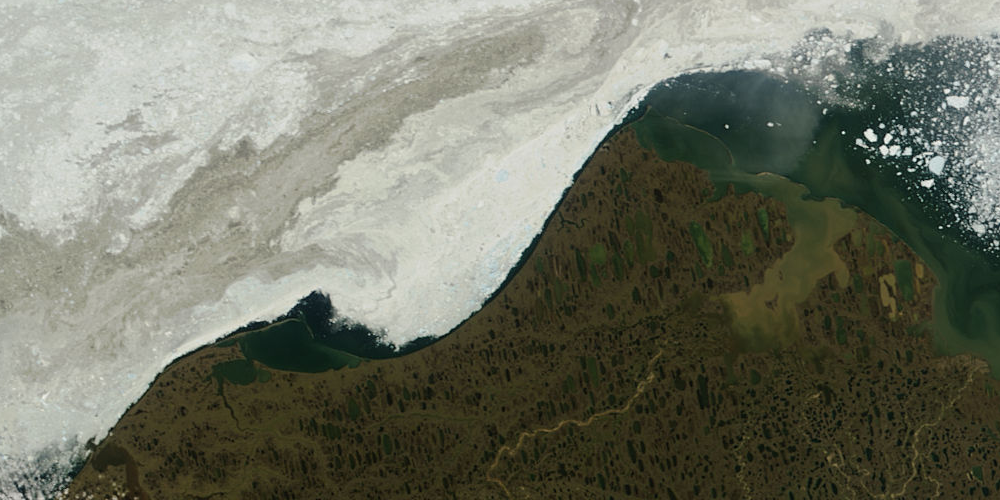
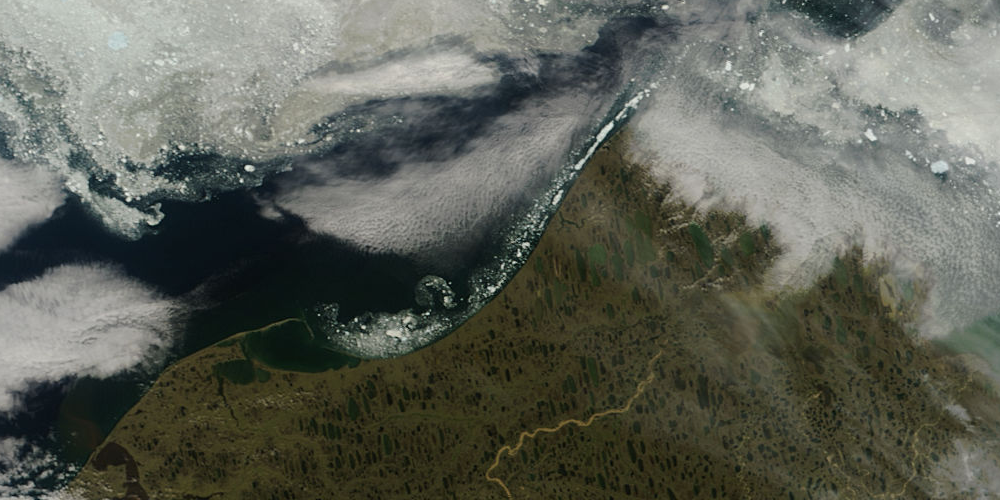
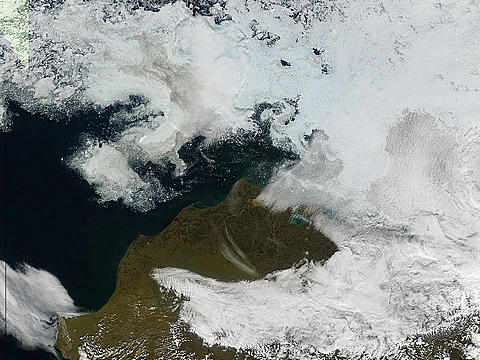
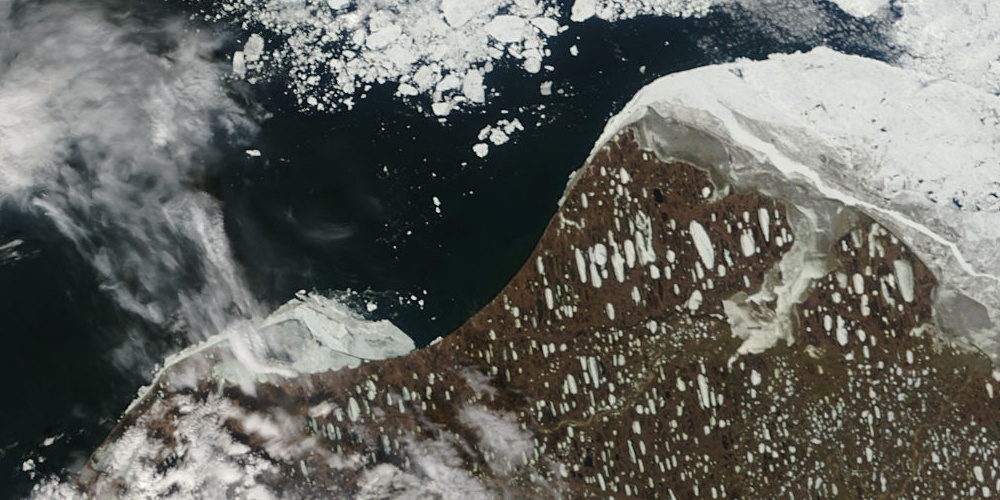
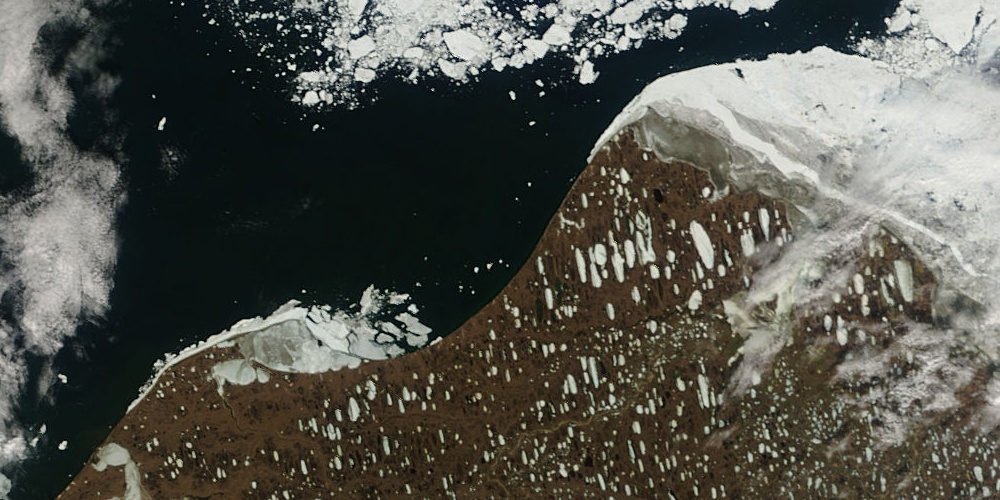
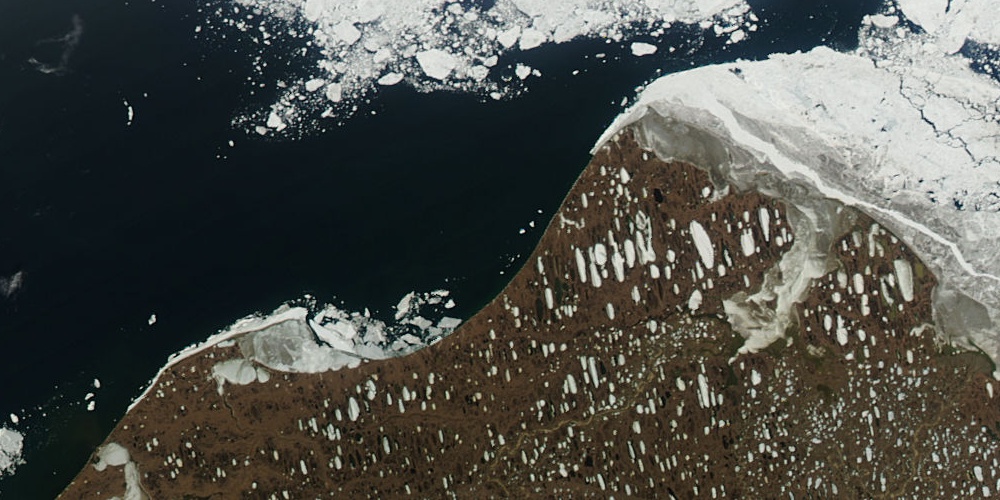
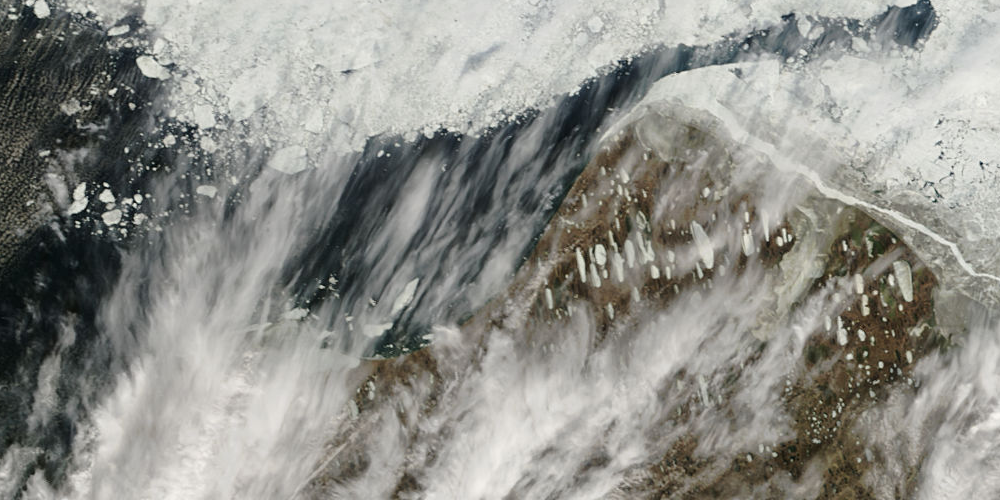
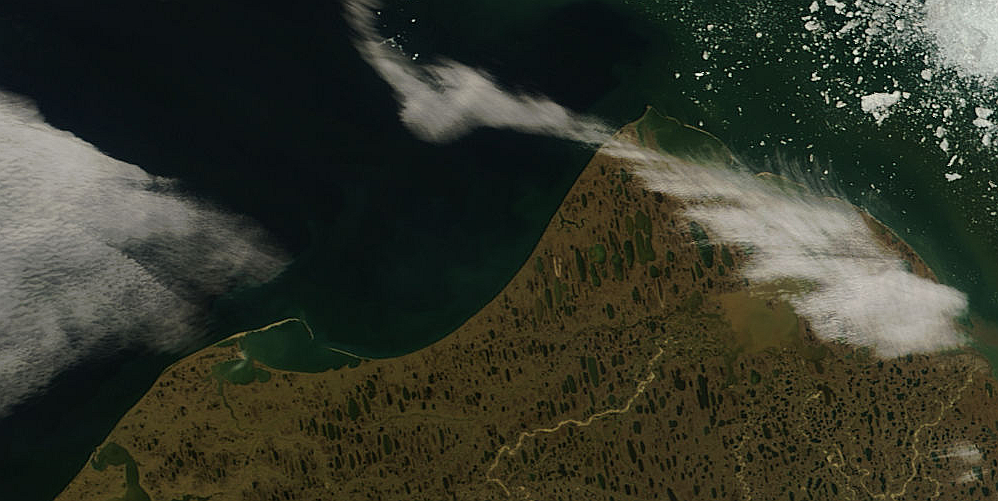
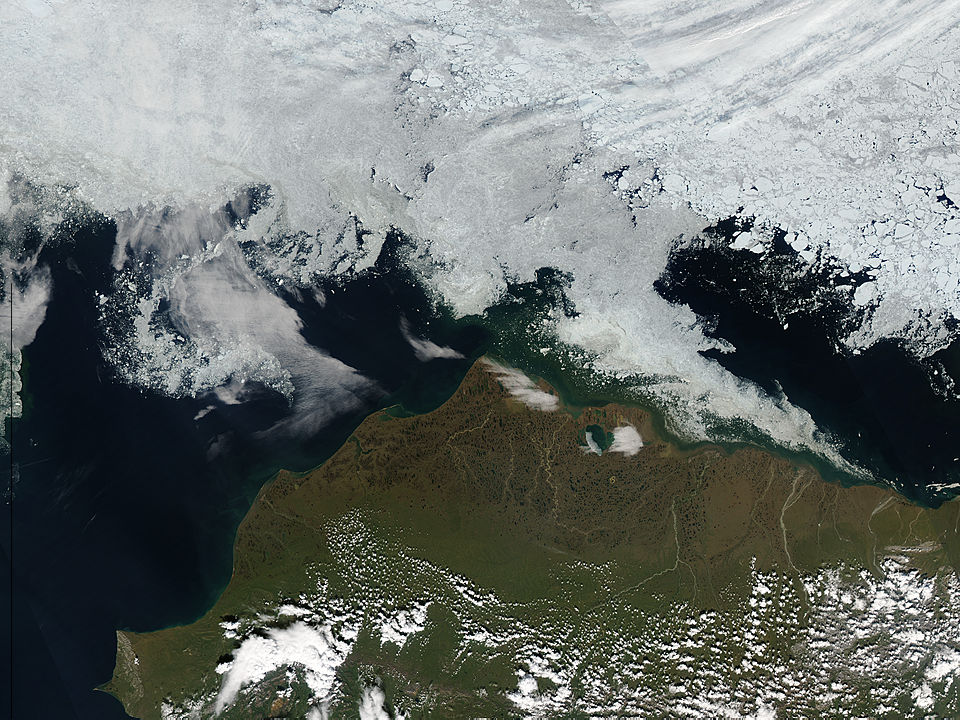
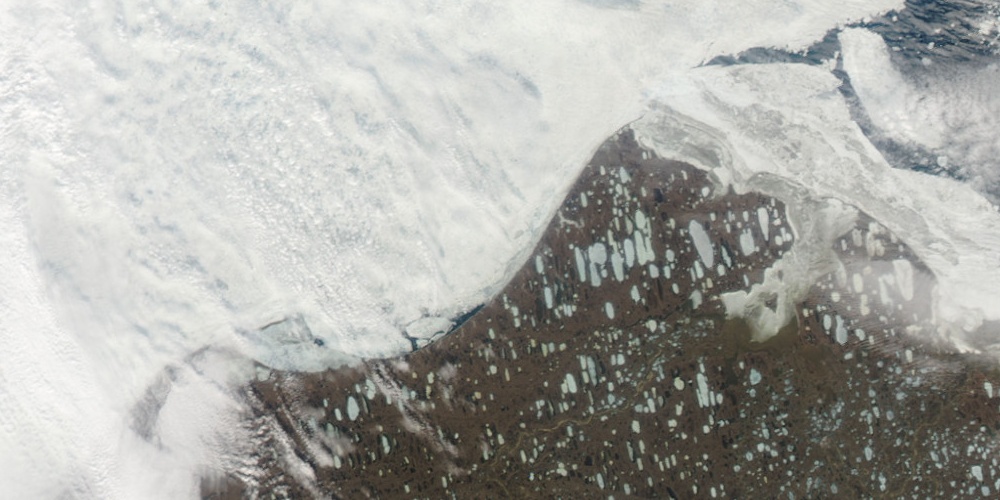
Annual break-up of landfast sea ice off the coast of Barrow, Alaska received international media attention in July 2009 after the USGS made available high resolution-satellite imagery that show inter-annual variability in coastal ice conditions. We would like to emphasize that the images released are scientifically extremely valuable. They both clearly demonstrate the year-to-year variability of ice conditions and document the progess of summer ice break-up in Barrow 2006 in unprecedented detail. However, unlike suggested by some, comparing summer ice conditions in July 2006 and July 2007 is not sufficient evidence to verify a trend.
We started in May 2009 to present detailed background information and analyses on the annual Barrow sea ice break-up on this page, covering the period 2000–2009.
A summary publication is available:Petrich, C., H. Eicken, J. Zhang, J. R. Krieger, Y. Fukamachi, and K. I. Ohshima (2012) Coastal landfast sea ice decay and break-up in northern Alaska: Key processes and seasonal prediction, Journal of Geophysical Research, doi: 10.1029/2011JC007339.
Sea Ice Break-Up Outlook for Barrow, Alaska
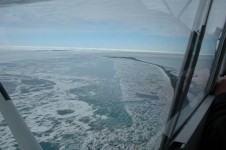
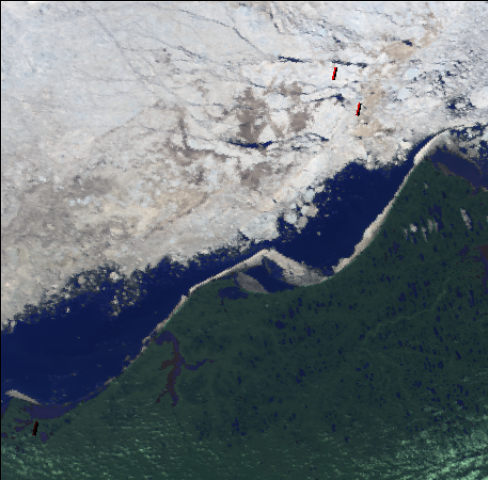
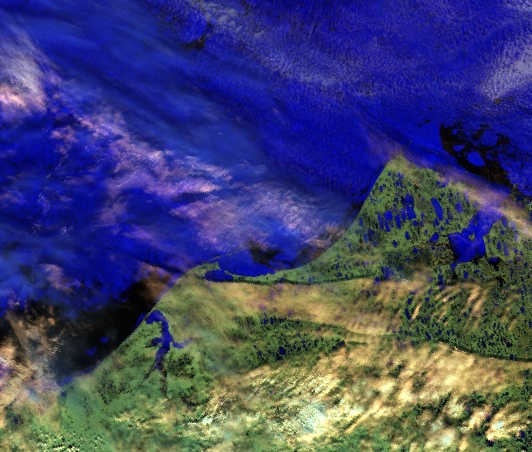
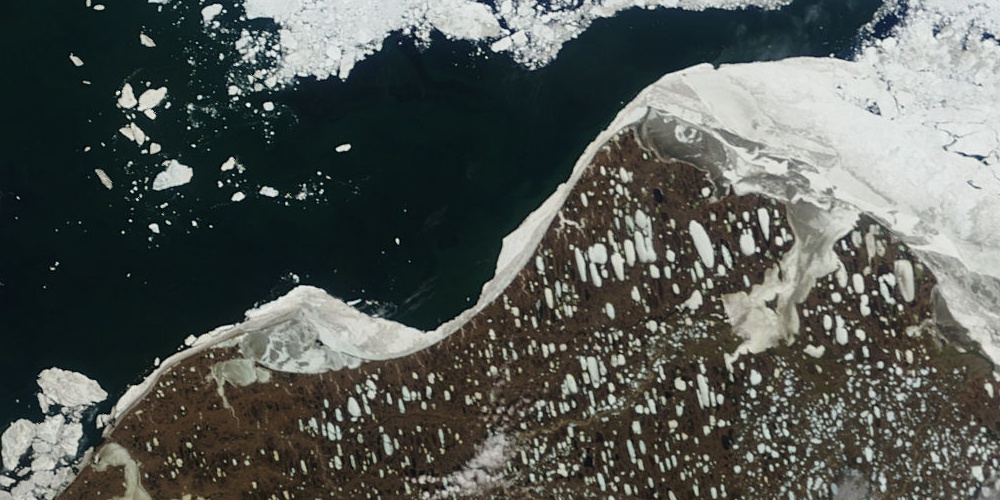
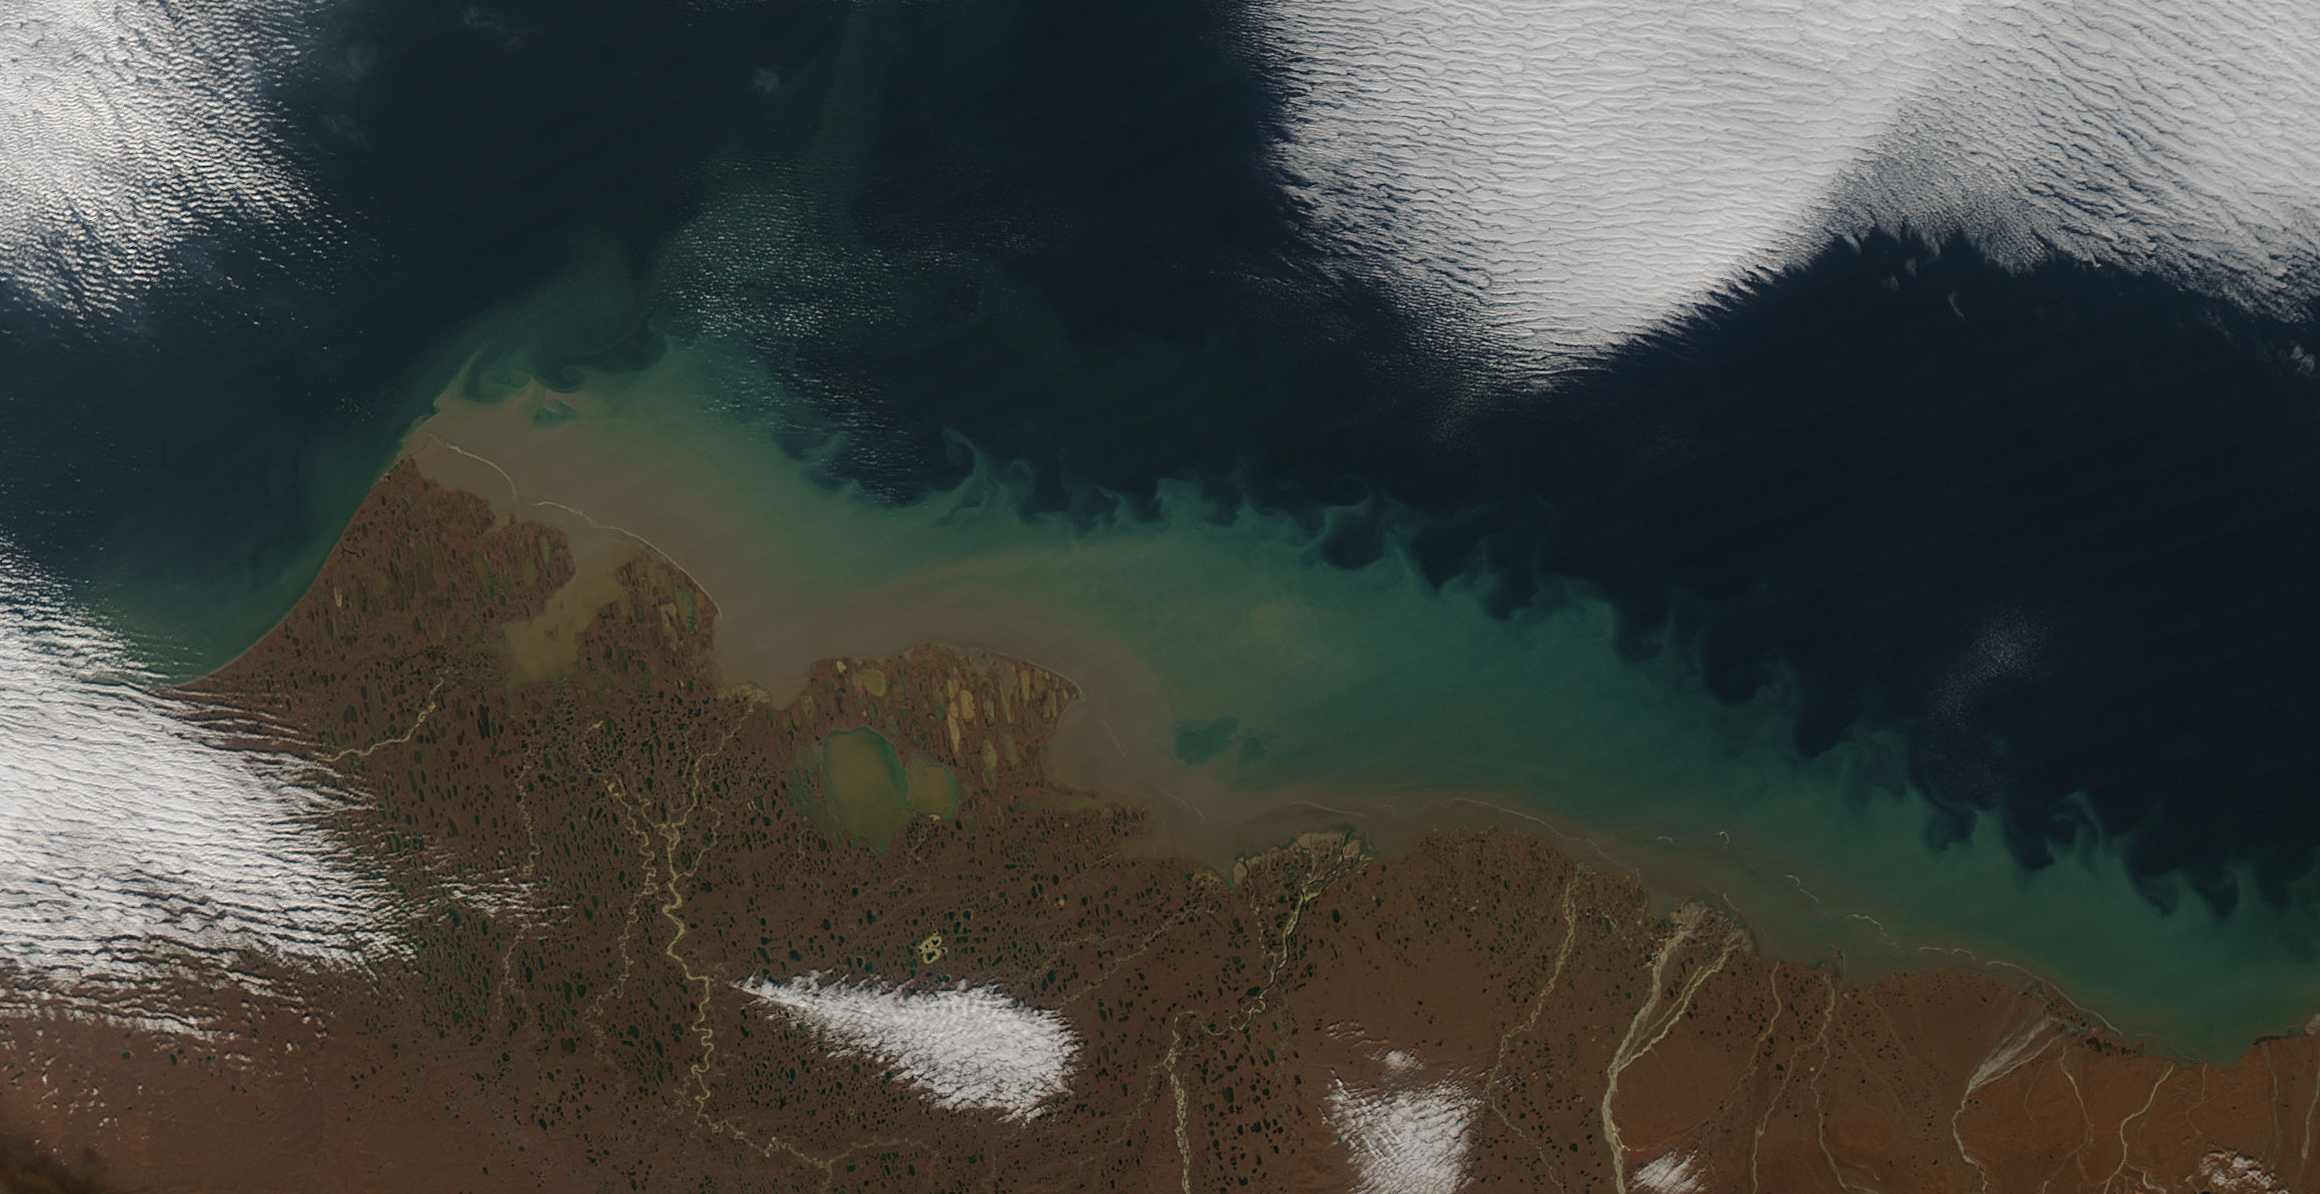
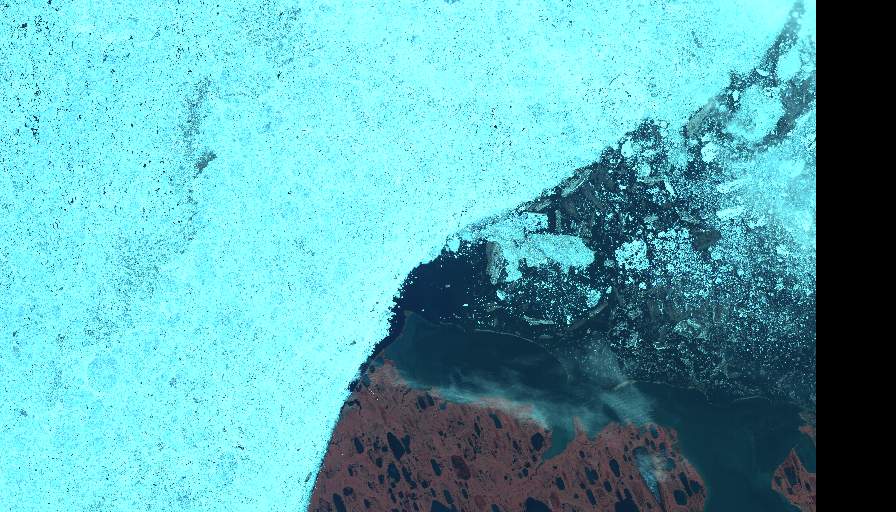
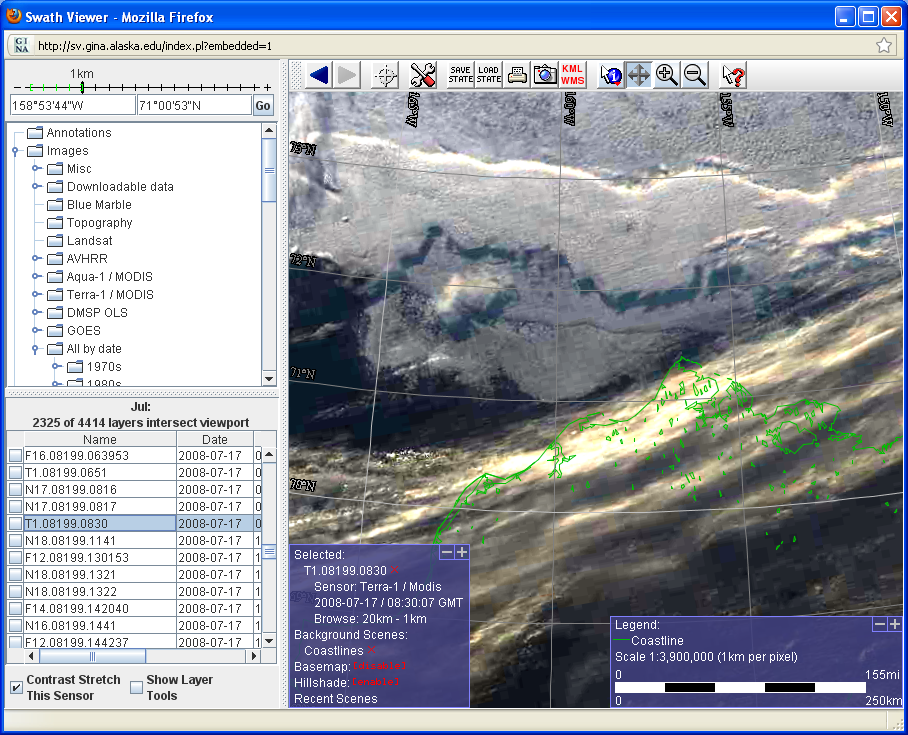
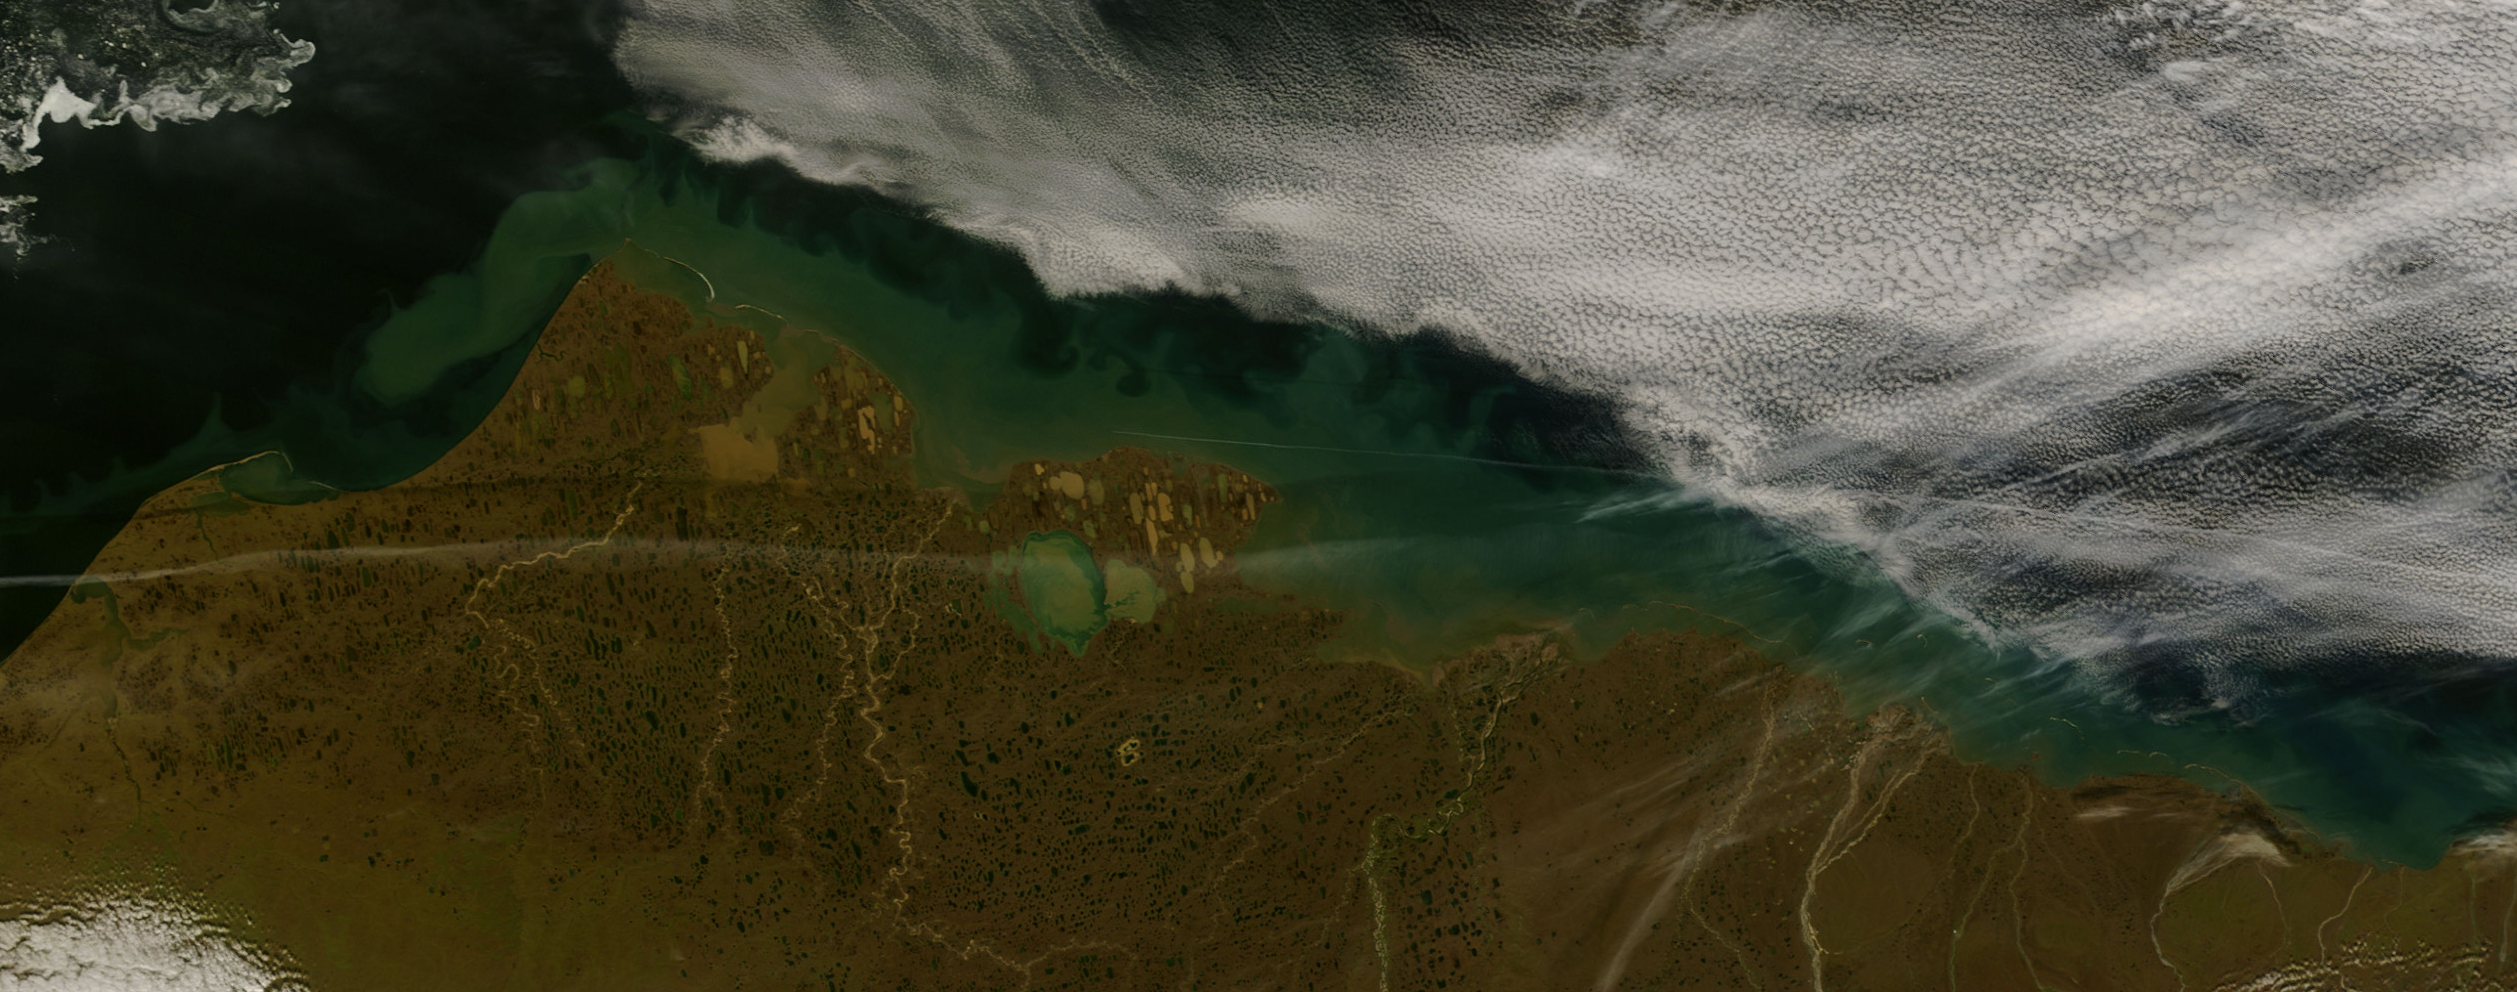
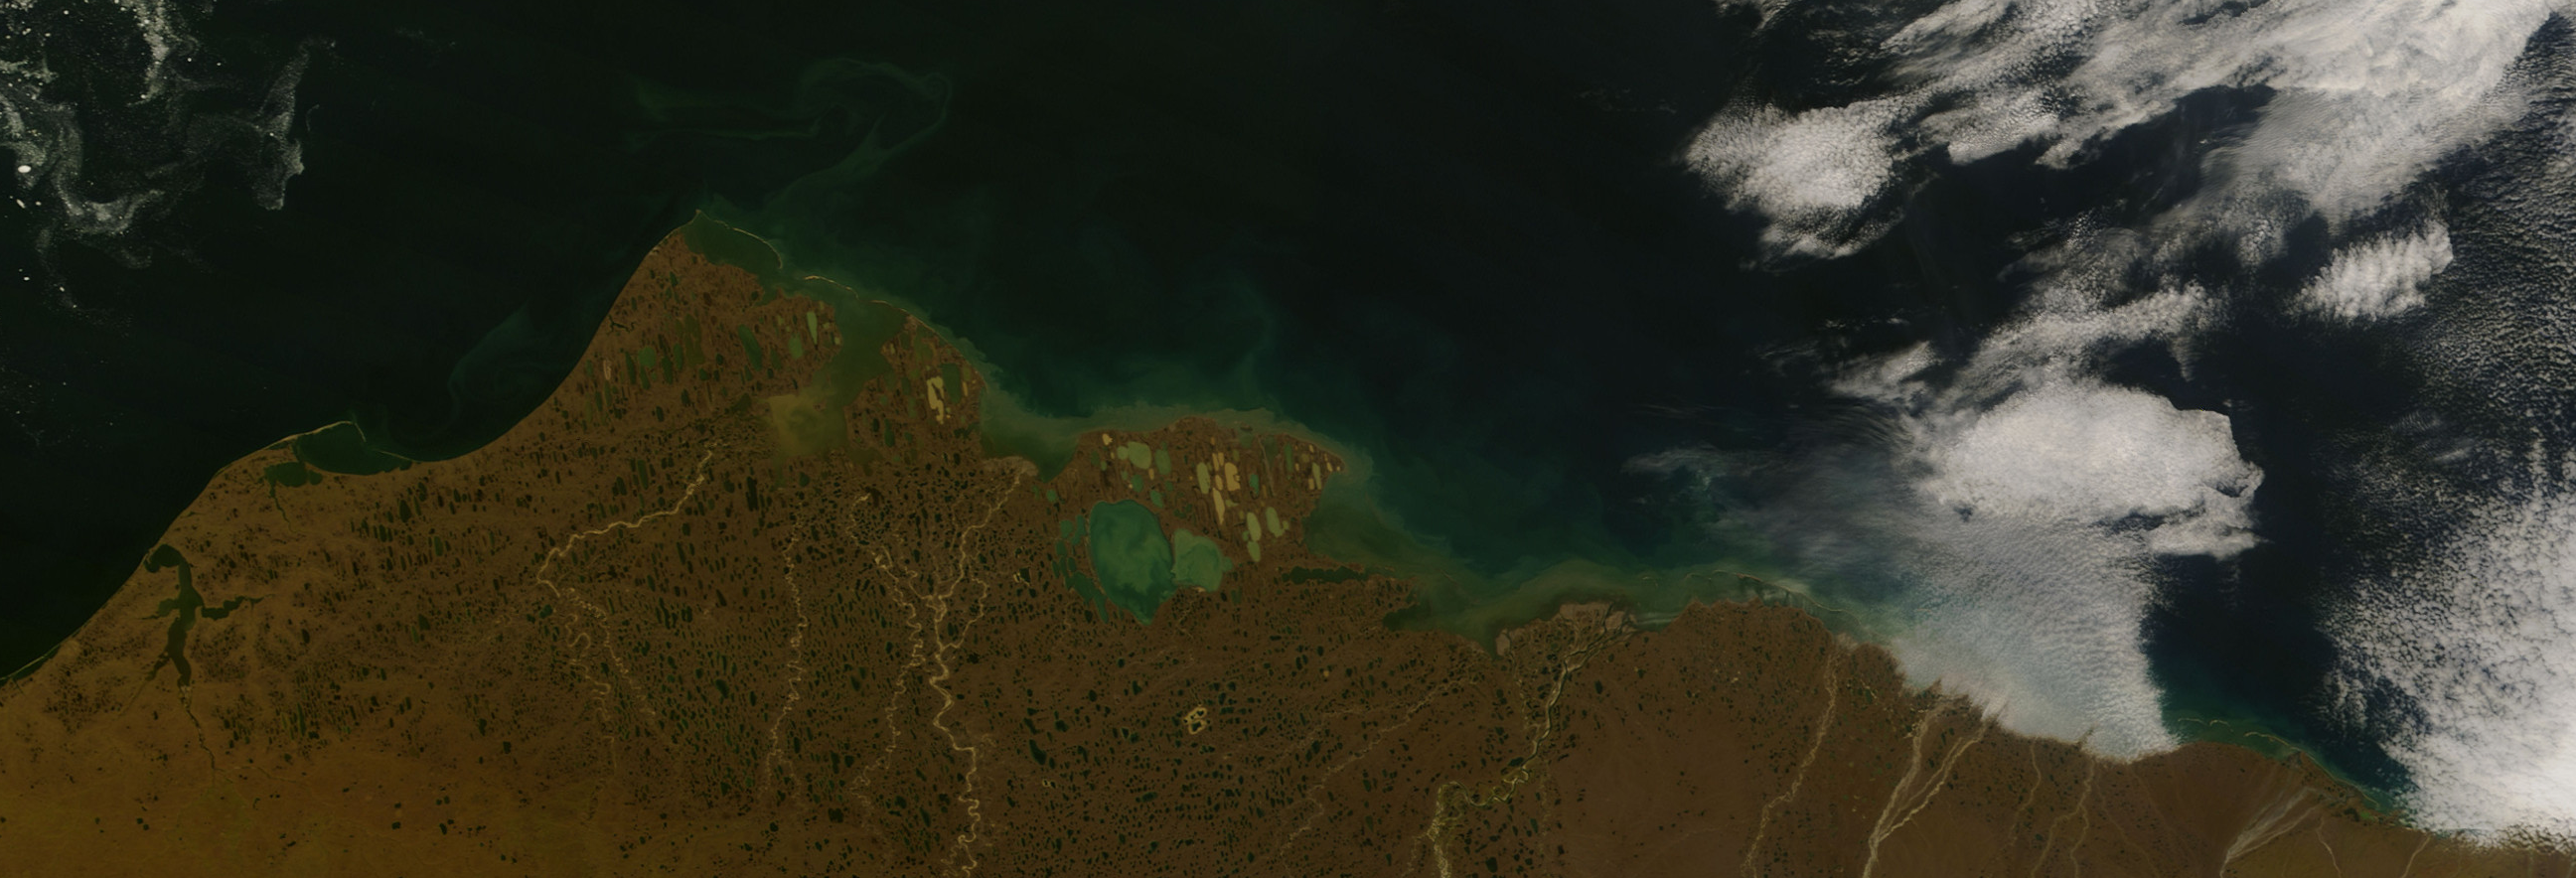
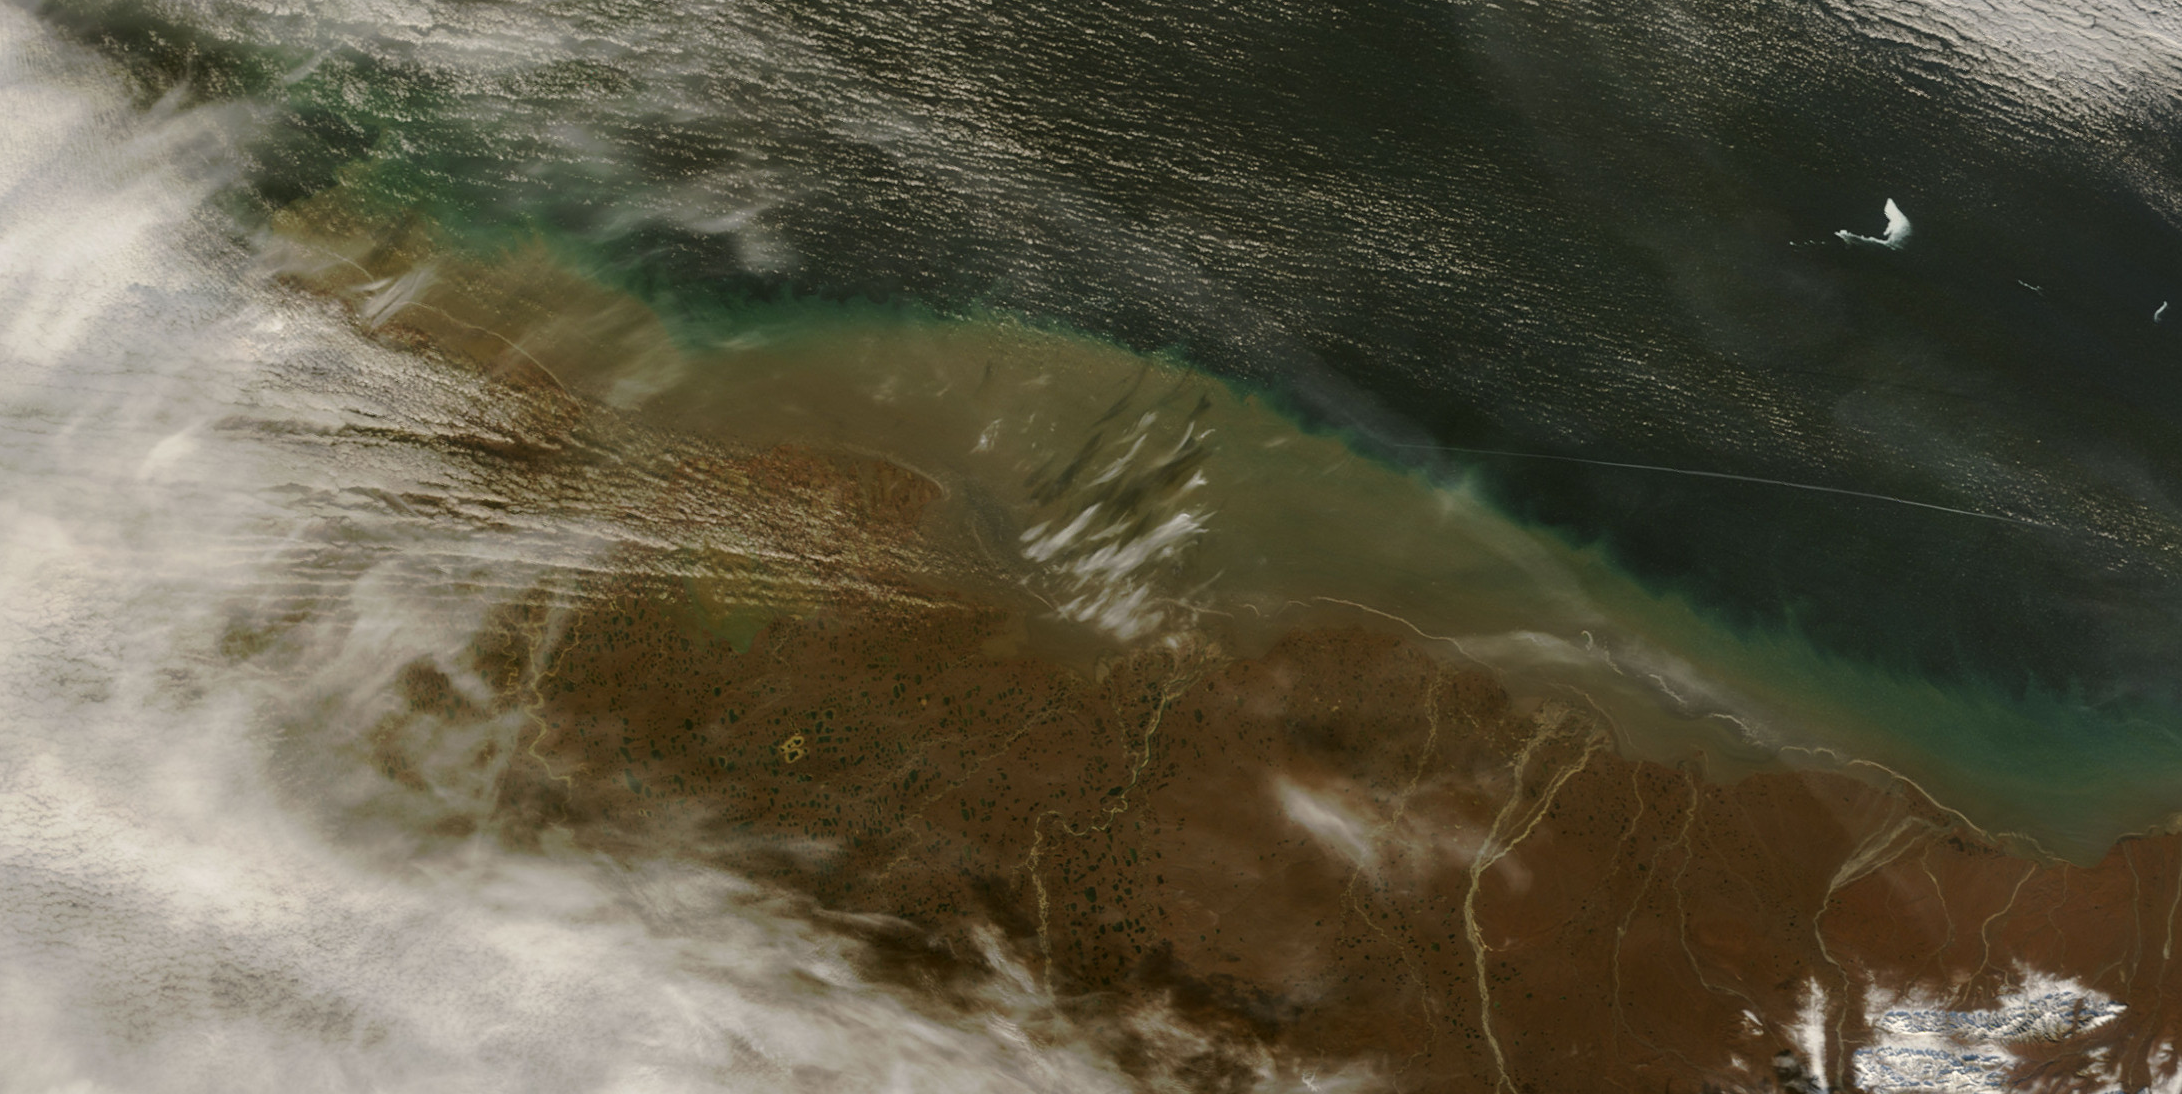
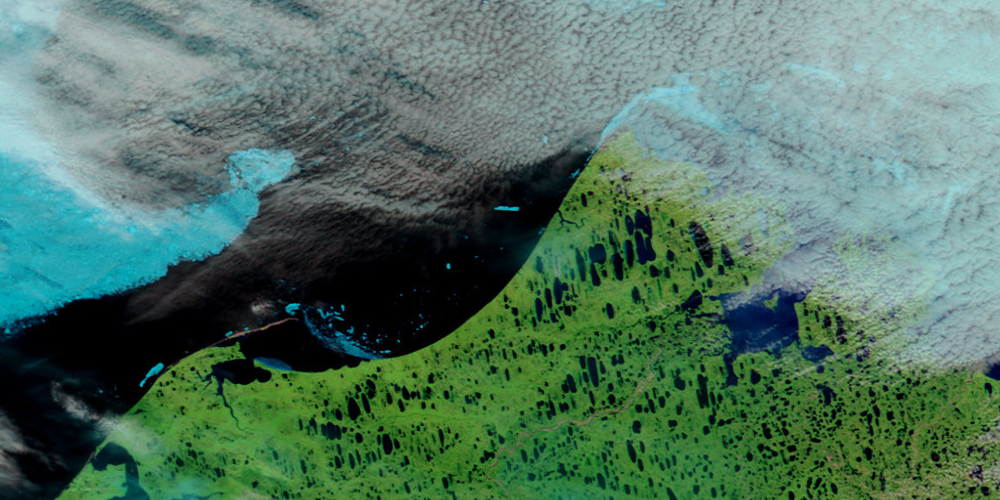
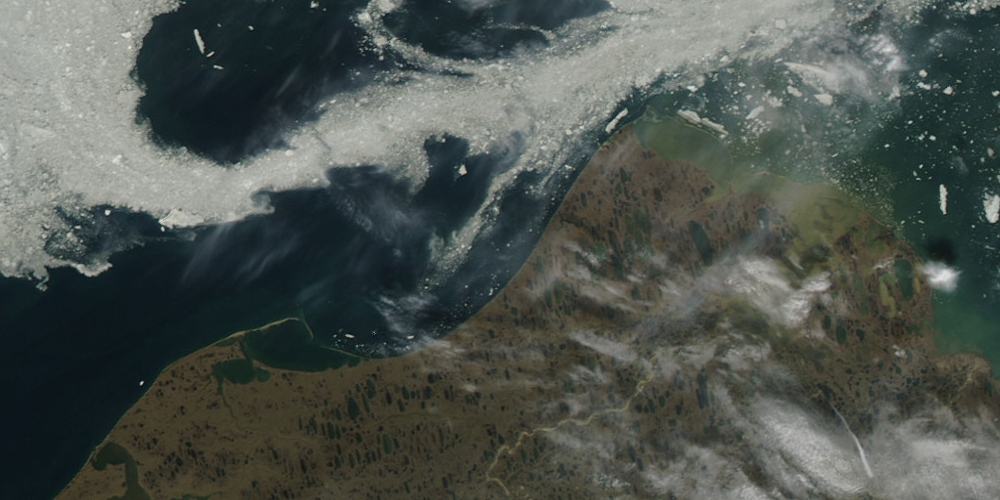
Melting ice in the region of interest, 2008
This is an experimental forecast of the break-up of landfast sea ice at Barrow, Alaska (specifically, Chukchi Sea, North of Barrow/Browerville: NARL—Niksiuraq—Point Barrow). This page is updated every day at 3 am and 3 pm AKDT.
Landfast sea ice has broken up for the purpose of this forecast, approximately 11 July 2009 (date to be confirmed).
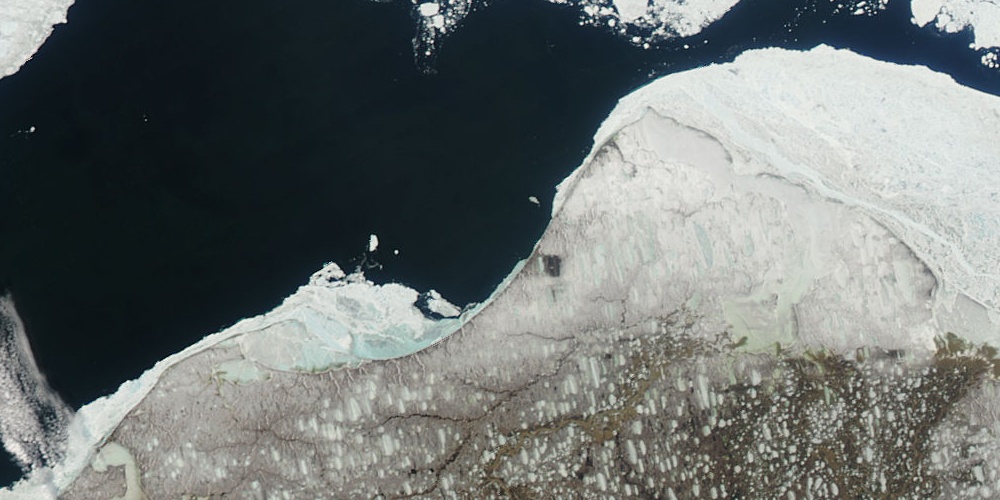
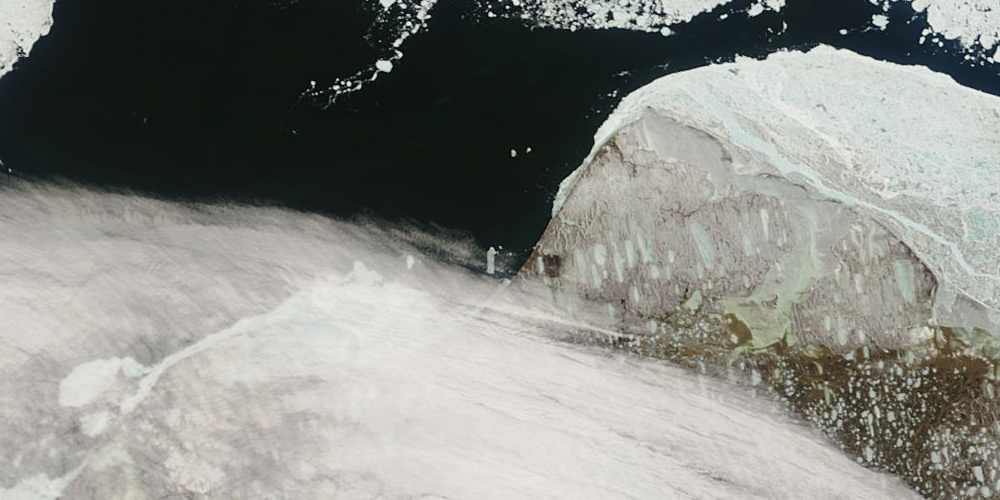
Progression of Sea Ice Decay and Break-Up at Barrow, AK (Chukchi Sea)
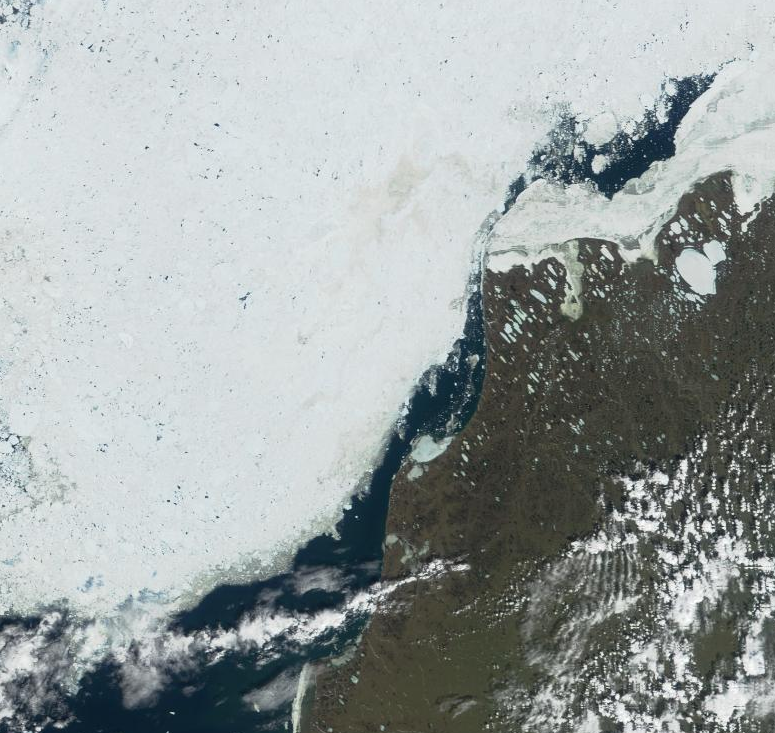
The first stage of melt encompasses partial removal of the snow cover and the formation of melt ponds. Once melt ponds appear at the surface, the absorption of solar shortwave (SW) radiation (sunlight) that penetrates the dark pond surface (as opposed to getting reflected at the white snow or ice surface) contributes to warming of both ice and upper ocean. The additional heat promotes warming and melt of ponded sea ice and a continuous reduction of ice strength. As a result of upper ocean warming, ice thins at the bottom and the keels of pressure ridges melt back. Usually, grounded pressure ridges with keels reaching the seafloor (typically in 10–20 m waterdepth at Barrow) contribute to the stability of the landfast ice cover. At Barrow, in years such as 2003 and 2004 lack of such grounded ridges leaves the ice inherently unstable. In summary, the progressive input of heat promotes decay of the sea ice cover in place while leaving it also more prone to being blown out during high winds or high tide.
In an attempt to treat break-up of landfast sea ice off the Chukchi Sea coast of Barrow systematically, we divide the Chukchi Sea ice into three components:
- pack ice drifting in the Chukchi Sea, specifically between Peard Bay (Point Franklin) and Point Barrow
- grounded pressure ridges off the coast of Barrow (part of the landfast sea ice cover)
- shore-fast landfast sea ice between pressure ridges and land

Specifically, floating ice attached to the pressure ridges on the seaward side is not considered explicitly. In summer (June, July, August) we find the following processes happening:
- pack ice may or may not fill the bay, and extend to the grounded pressure ridges or an open lead seaward of the pressure ridges in early June. At some point during summer pack ice receeeds from the pressure ridges leaving a vast stretch of open water seaward of the pressure ridges (pack ice close to shore may come back in late summer in heavy ice years).
- grounded pressure ridges may loose significant contact with the sea bed due to melting keels and high sealevels. Hence, they become increasing prone to being blown out by strong winds as the summer season progresses. Some years may not even see pressure ridges that are grounded.
- shore-fast landfast ice weakens due to surface melt (heat from the atmosphere), internal melt (absorbed solar radiation), and bottom melt (heat from the ocean). It may
- melt out being locked in place by coast pressure ridges and heavy ice North and South of the Barrow/Point Barrow region. Being confined to the shore it will generally move up and down the coast following the winds.
- drift out after disintegrating into floes in place (either thermodynamically (sun) or dynamically (winds)), and being subjected to winds that blow this ice past disintegrating pressure ridges North or South of the Barrow/Point Barrow area.
- break out at the same time or right after pressure ridges break out without disintegrating into confined floes frist.
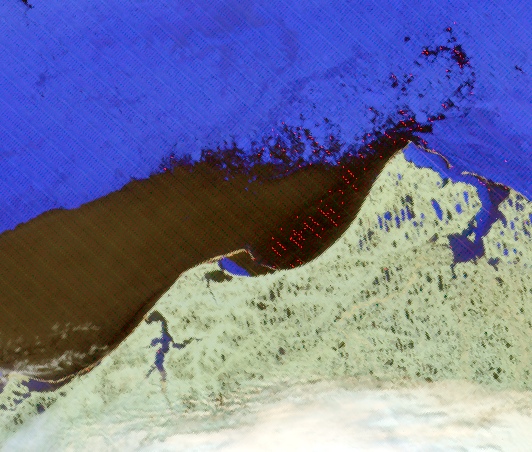
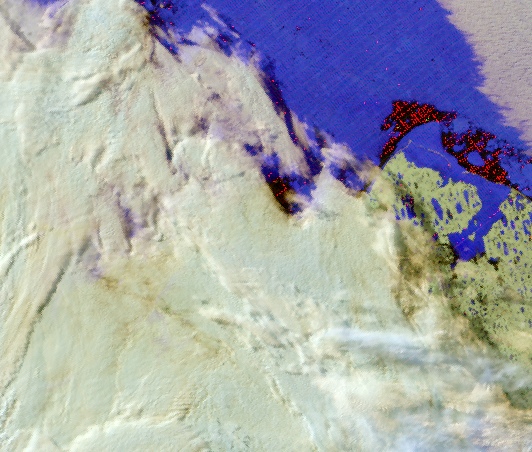
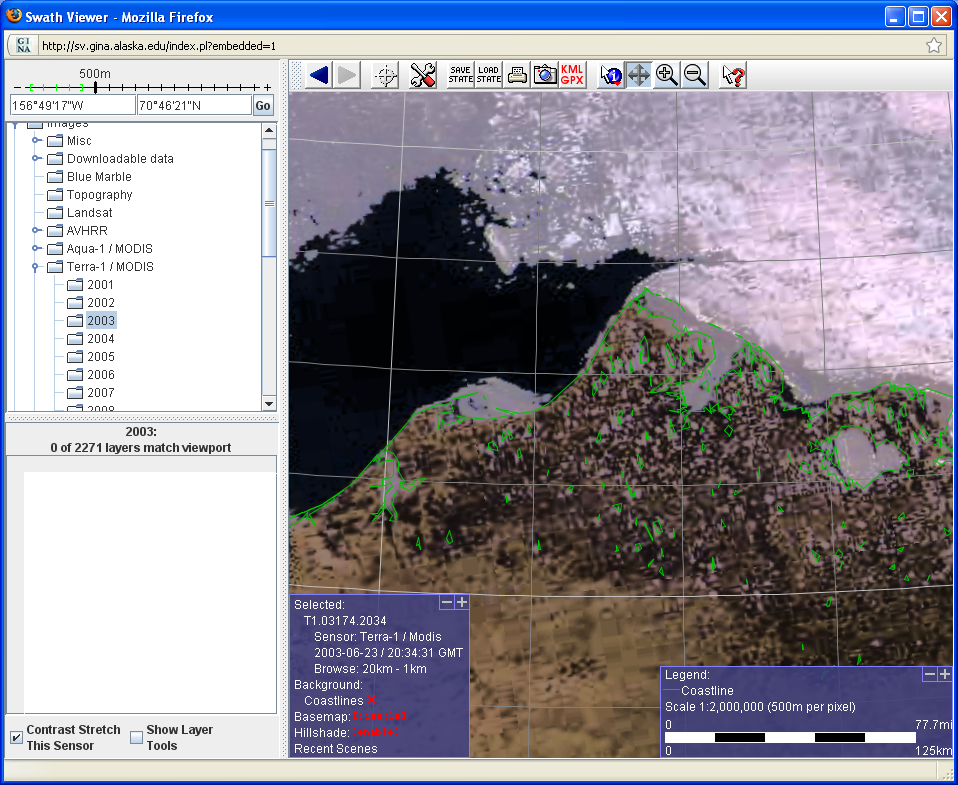
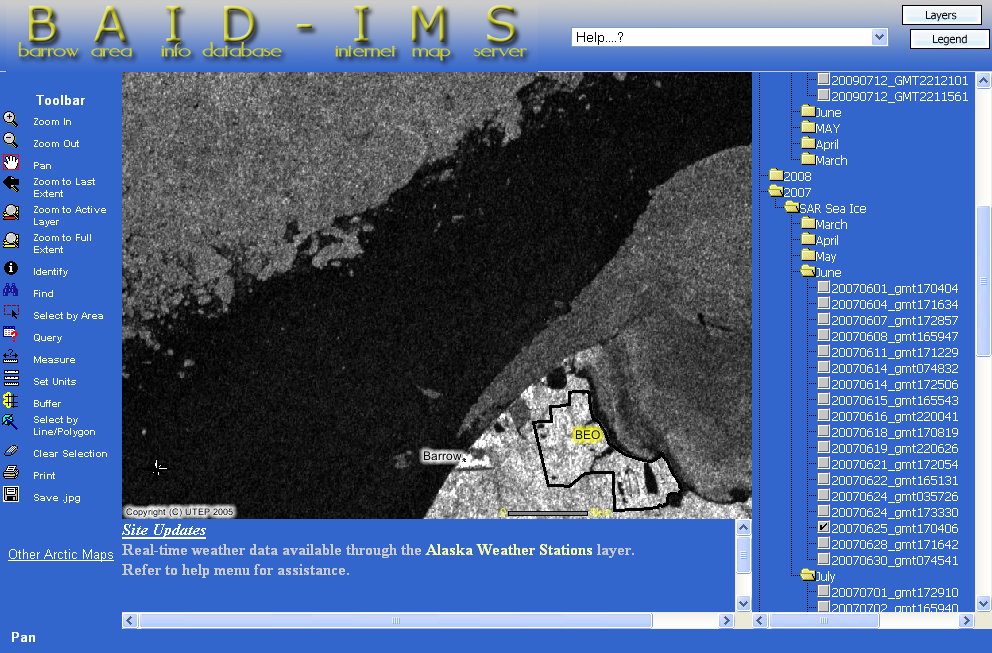
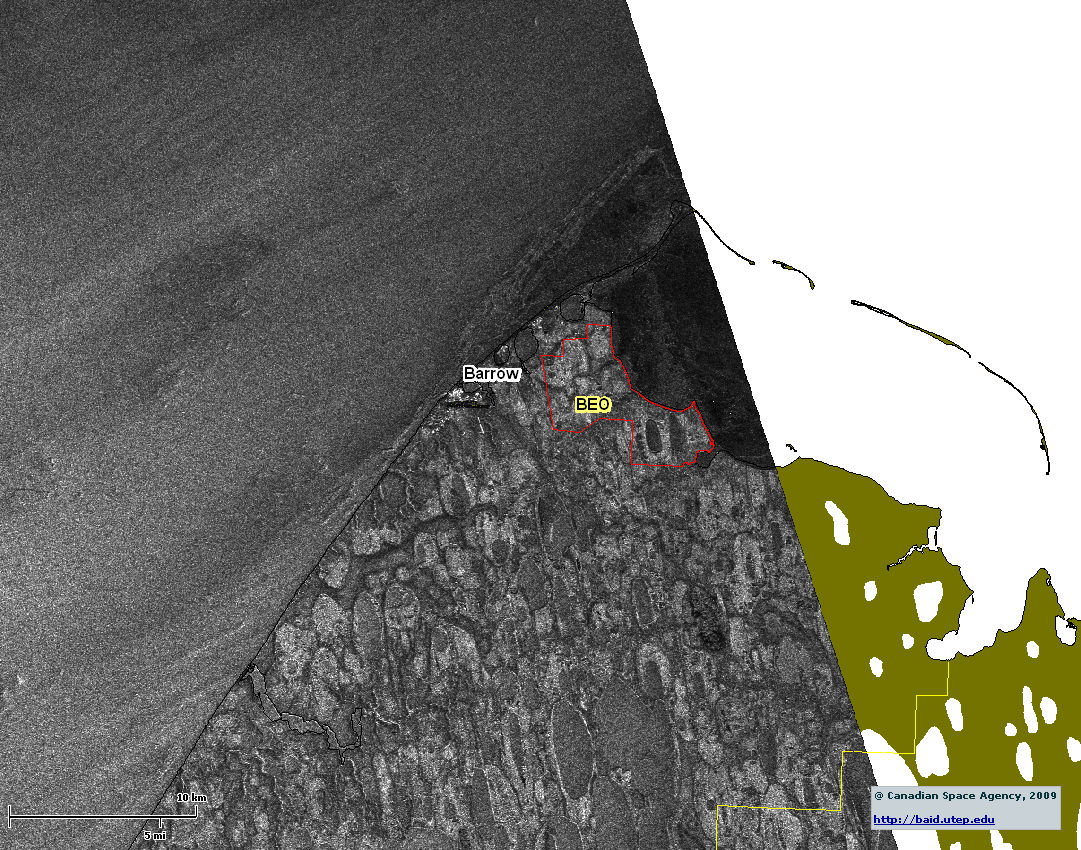
We define break-up as motion of shore-fast landfast sea ice at the site of the National Arctic Research Laboratory NARL (i.e. between Browerville and Point Barrow, see USGS topo map).
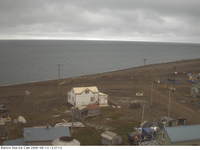
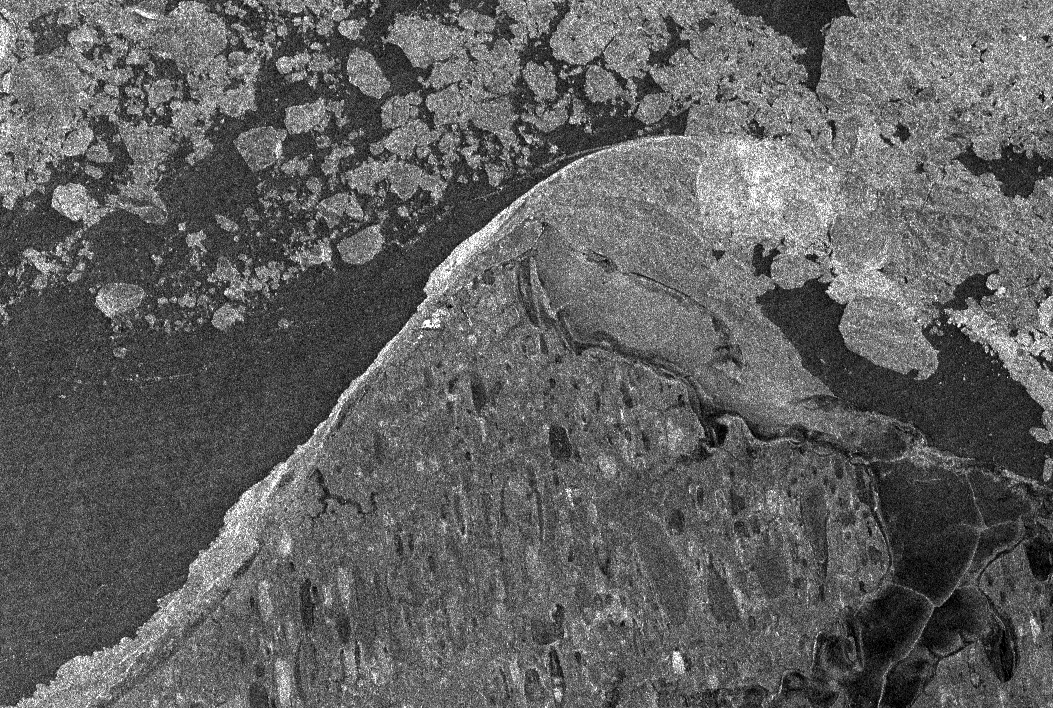
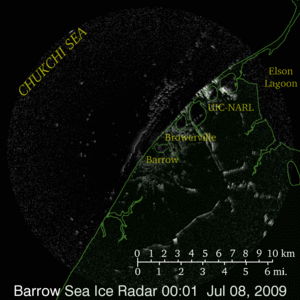
In years of melt-out and drift-out we expect to be able to predict the timing of break-up based on atmospheric conditions, in particular solar radiation. We expect to see break-out in years of missing or few pressure ridges, and postulate that break-up takes place earlier than expected from thermal consideration. The break-up process is documented with webcam imagery (2000–present)and coastal X-band RADAR (2006–present) (see data archive for webcam and radar).
Current Weather and Short-Term Expectations
We base our estimates on the following parameters measured in Barrow:
- air temperature,
- incoming shortwave radiation ("sunlight"),
- wind, air pressure, and sealevel
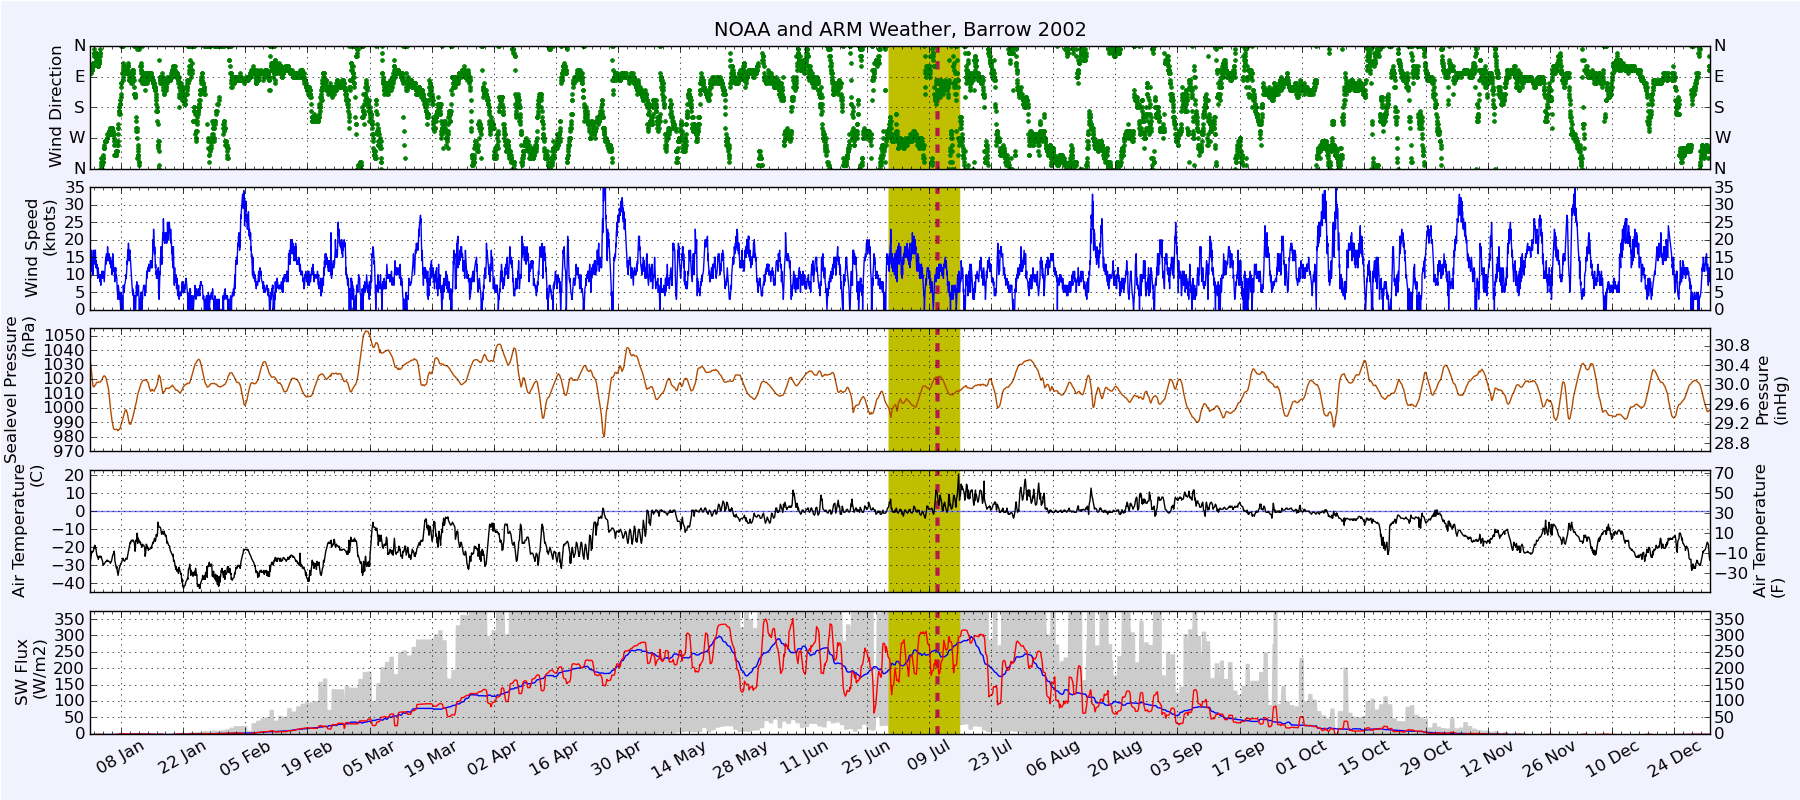
Air Temperature
Air temperature is the primary indicator for daily mean snow melt rates. In general, snow can be expected to melt while the air temperature is above 0 °C (cf. this year's data). However, snow fall, drifting and blowing snow are much harder to predict.
Currently, instead of predicting the date of melt pond formation we assume that this happens on June 5. This assumption is based on observations over the past several years.
The albedo of tundra may serve as an indicator for the disappearance of the snow cover in previous years and hence indicate the early stages of meltpond formation on sea ice. Note that this comparison is not backed-up by a systematic investigation.
For example, the ground albedo at the ARM site (snow covered: 0.75 to 0.9; snow free: around 0.2) reached or fell below 0.68 on the following days in recent years: 19 May 2002; 3 June 2007; 4 June 2004 and 2008; 6 June 2003; 7 June 2006; 9 June 2000; 11 June 2001; several times between 1 June and 11 June 2005 (albedo around 0.7 between those dates); and on 21 May and 2 June 2009 (albedo around 0.6 between those dates).
Similarly, the presence of snow and ice (both on land and on the ocean) damps air temperature excursions. Using the airport air temperature as an indicator, the first day the daily maximum temperature is more above +0.5°C than the daily minimum temperature is below +0.5°C are: 2000: 6 June; 2001: 11 June; 2002: 22 May; 2003: 4 June; 20 May; 2005: 11 June; 2006: 8 June; 2007: 4 June; 2008: 4 June; 2009: 30 April, 18 May, and 1 June. Apart from 2005, these numbers are consistent with the reduction of the tundra albedo.
Spot measurements at the Barrow airport (PABR) of maximum snow depth registered in April and the first day of <1 inch snow are as follows: 2000: 9", 1 June. 2001: 11", 31 May. 2002: 12", 10 May. 2003: 11", 17 May. 2004: 12", 20 May. 2005: 9", 27 May. 2006: 15", 7 June. 2007: 13", 6 June. 2008: 22", 5 June. 2009: 16", 25 May.
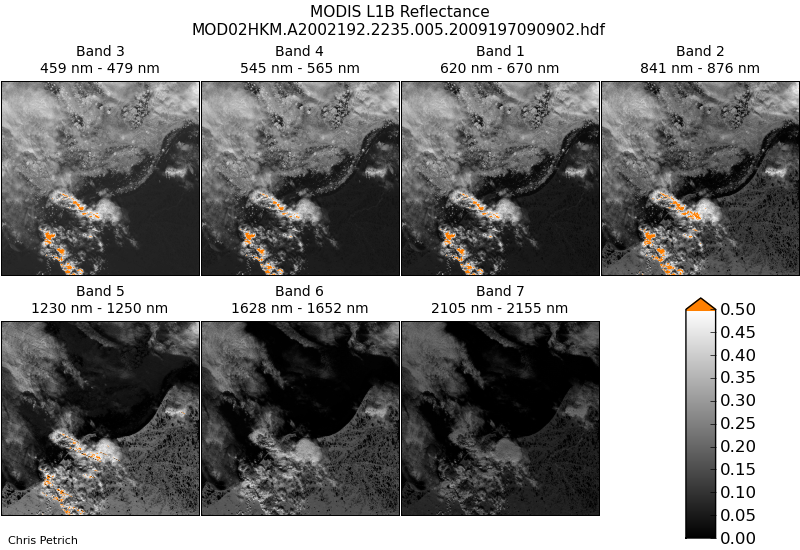
Webcam timelapse recordings of coastal sea ice were taken at varying locations (at NARL 2000–2005; downtown 2006–current; note the proximity to a road with the general potential for dust on the snow). Currently available on youtube: seasons ending 2000, 2001, 2002, 2003, 2004, 2005, 2006, 2007, 2008.
Solar Radiation

Larger Image Note that weather forecasts are not reliable beyond 3–7 days!
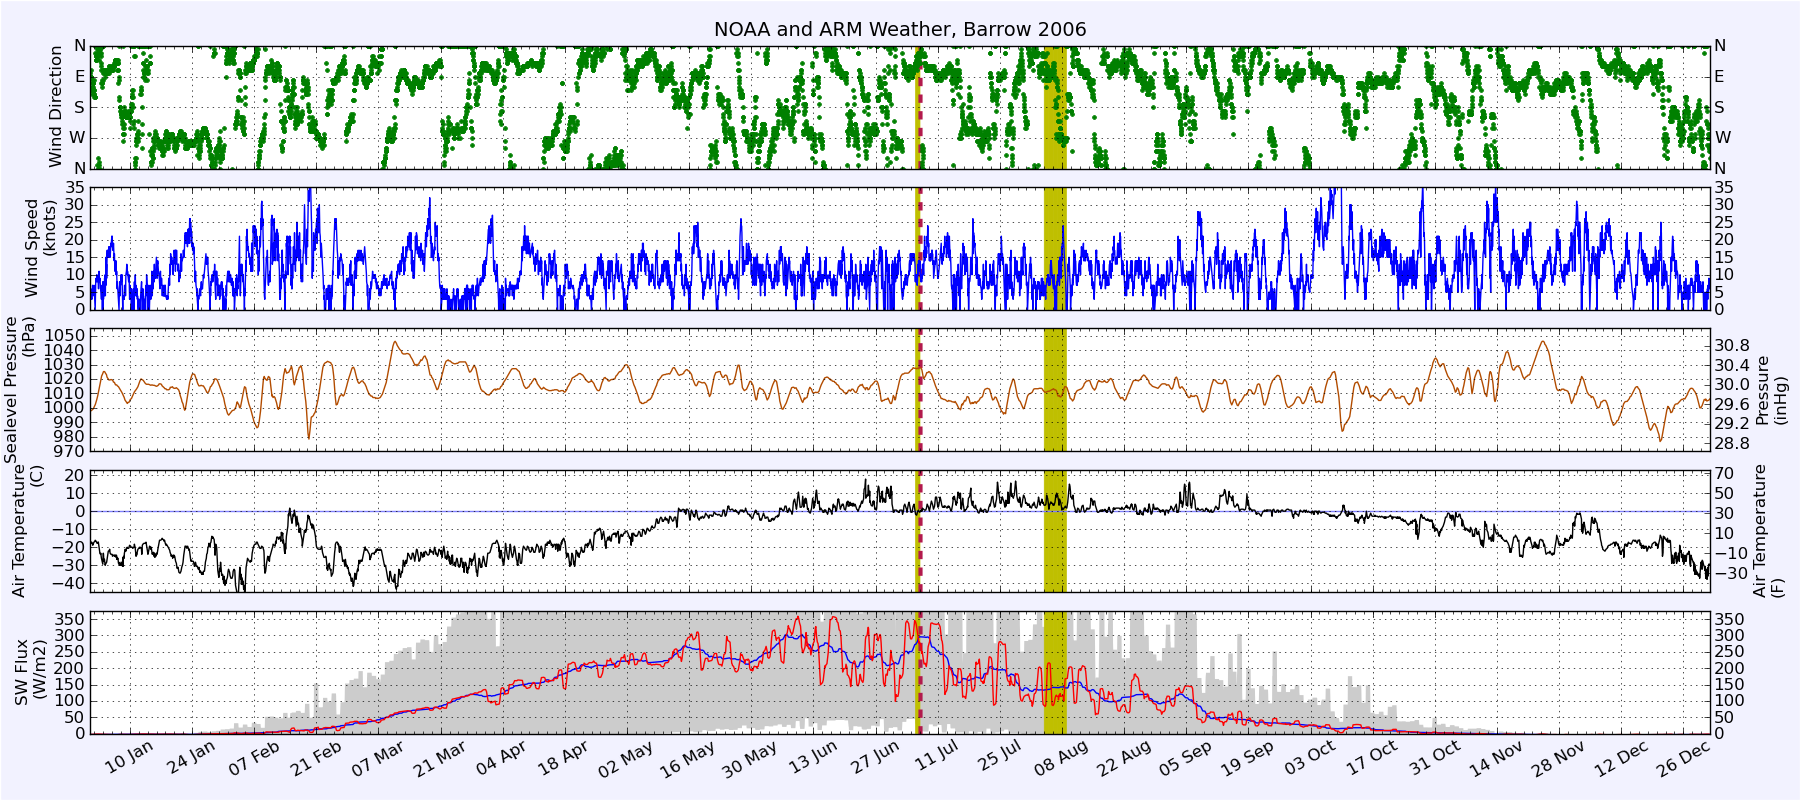
We assume that incoming shortwave radiation is a good indicator of landfast ice weakening and decay. In order to place this year's progression of melt in the context of previous years, we use the most recent radiation data available from the Atmospheric Radiation Measurement Program (ARM) site northeast of Barrow. These data are available with approximately 3–4 days delay.
On days without radiation measurements we estimate the incoming shortwave radiation based on the hourly cloud coverage reported by NOAA at the Barrow Airport and the expected clearsky radiation for the day.
Solar radiation on days in the future is forecasted with a
WRF model run by the UAF Mesoscale Modeling and Applications Group. Weather forecasts are not reliable beyond 3–7 days, and this forecast is no exception. Forecast data plotted in the figure above for days in the past are the 24-hour forecasts for the respective days.
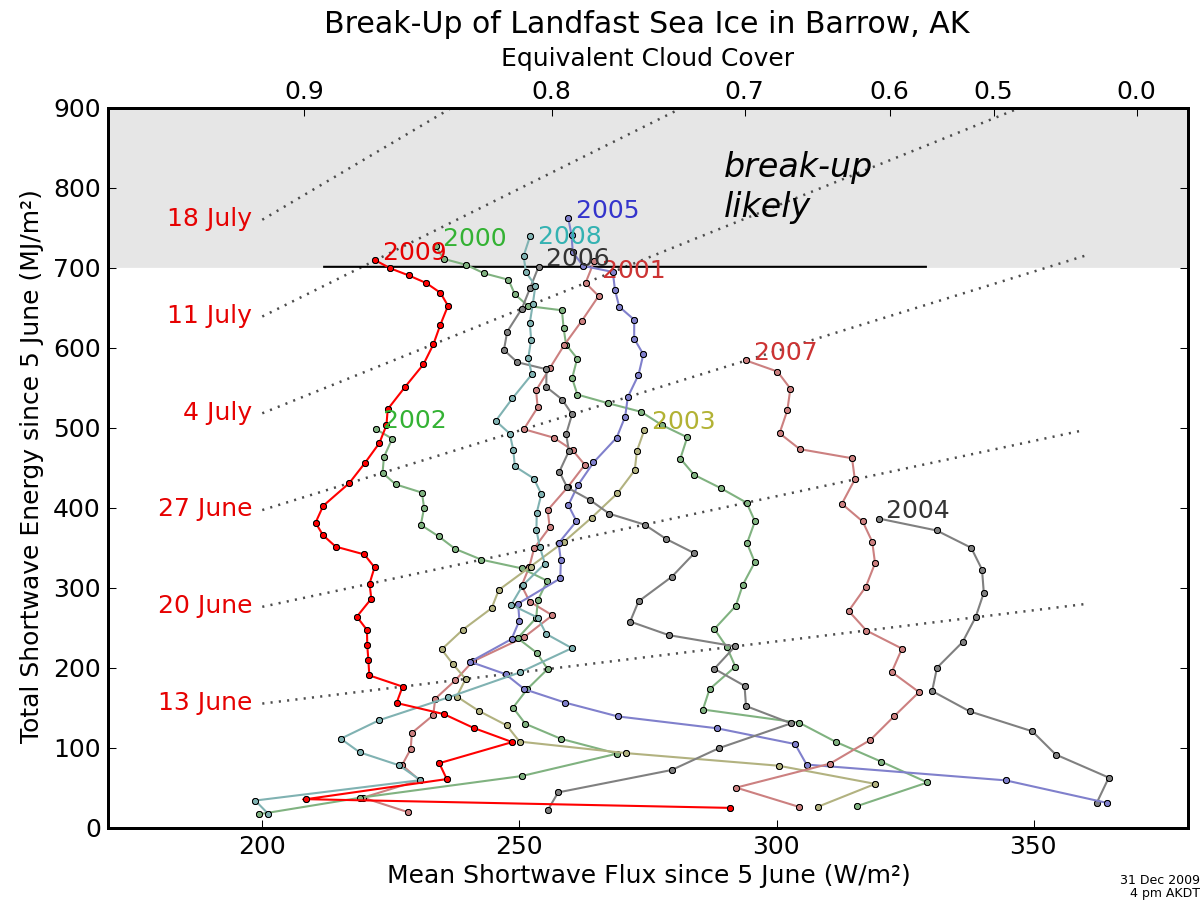
Larger Image The lines are colored to help guide the eye.
Equivalent Cloud Cover is approximate and for illustration only.
In years with significantly grounded pressure ridges level and rubbled landfast sea ice close to the shore will break up by either melting out in place or drifting out. In either case, the ice will be structurally weakend and disintegrate into individual floes. In the figure above we use the accumulated incoming shortwave flux as an indicator for the time this break-up occurs. The start date of June 5 is chosen as it is typical the beginning of meltpond formation. However, meltpond formation started probably 2 weeks earlier in 2002, resulting in ice drifting out significantly earlier than expected from this figure. In 2003, 2004, and 2007, ice broke out in the absence of grounded pressure ridges, which cannot be predicted with this approach.
The figure above contains this year's path already taken (bright red, end point labeled 2009), and the expectation based on the 16-day extended WRF forecast (dark red line, end point labeled 2009???).
Here is a reconstruction of the predicted break-up date with time. It appears a 16-day weather forecast can be a valuable contribution to prdicting break-up.
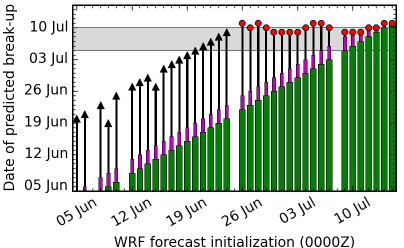
Date of break-up forecasted for 2009 versus initialization time of the WRF model.
Circles indicate the expected break-up dates, triangles indicate the end of a WRF forecast run without expected break-up. The vertical bars indicate the source of incoming shortwave flux, i.e. ARM measurements (thick vertical bars), estimates based on observed cloud cover (medium thick vertical bars) and WRF runs (thin vertical bars). The thin horizontal lines indicate the range of break-up dates 2000–2008 (years with melt-out or drift-out, except 2002).
Note
In order to take advantage of the ARM data delivery cycle, a day is defined from midnight to midnight UTC in the three plots above. As a result, a daily average reported for June 5 is based on the time between June 4, 4 pm AKDT and June 5, 4 pm AKDT.
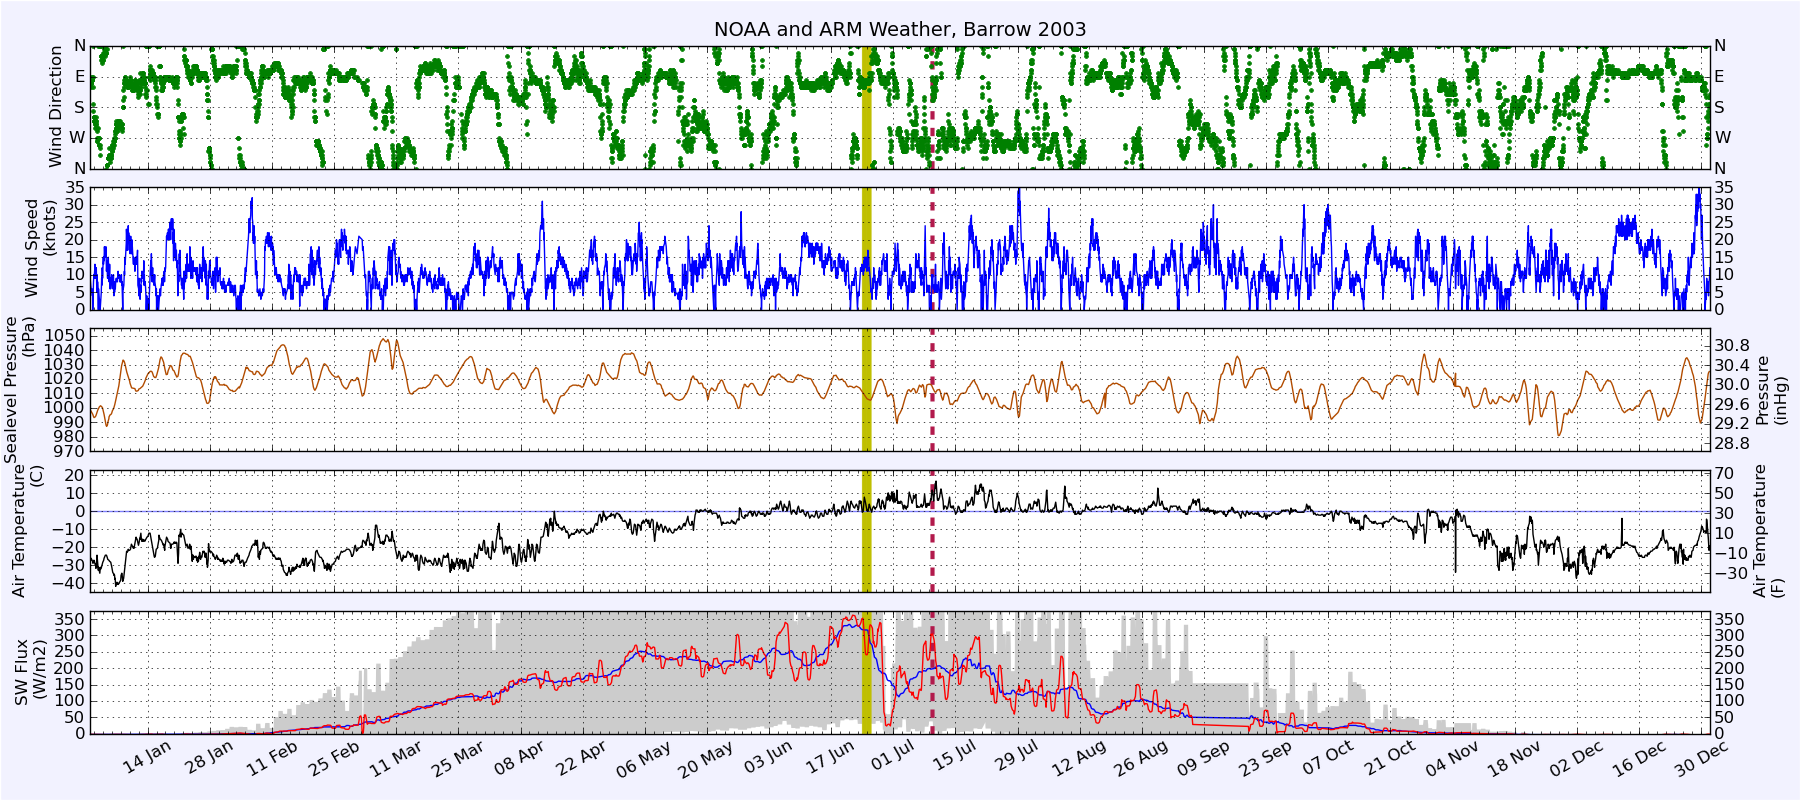
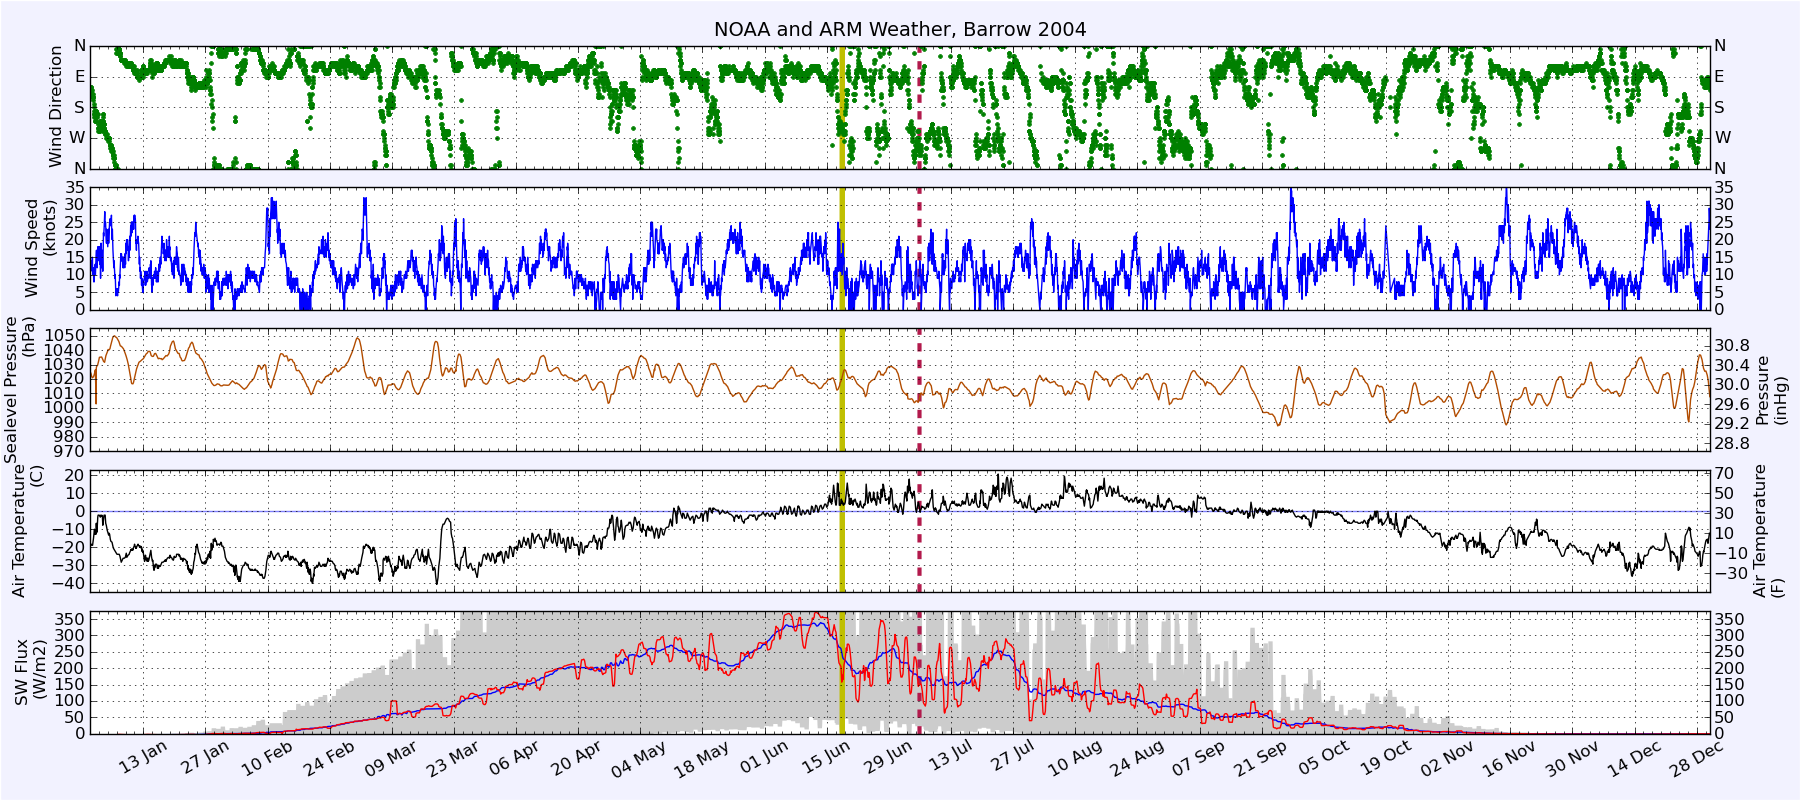
Wind, air pressure and sealevel
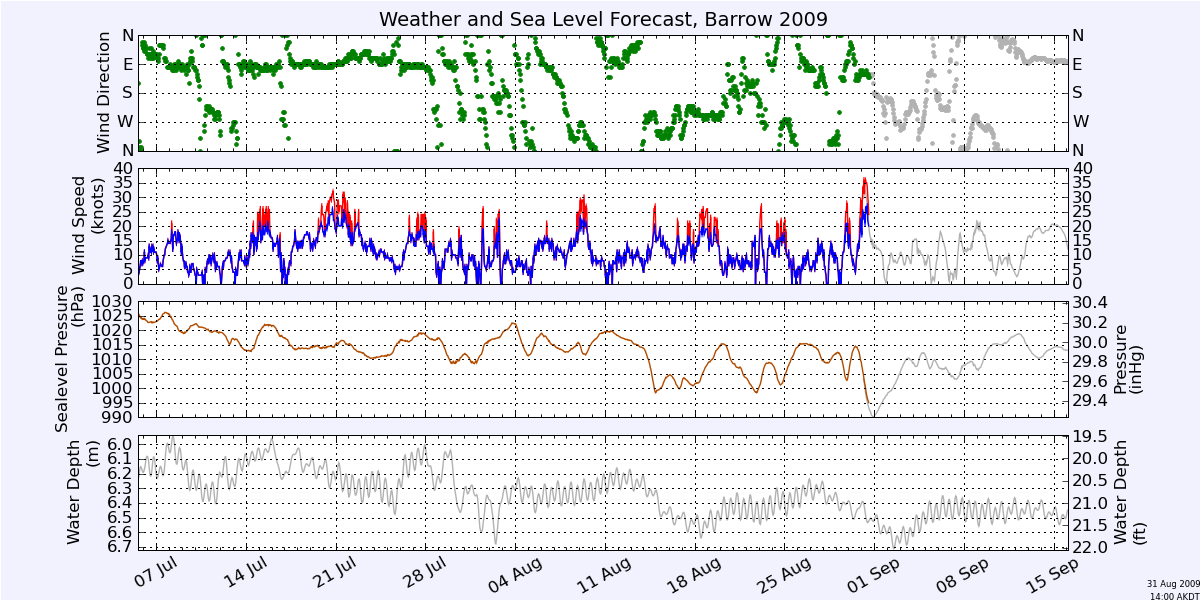
Larger Image Note that weather forecasts are not reliable beyond 3–7 days!

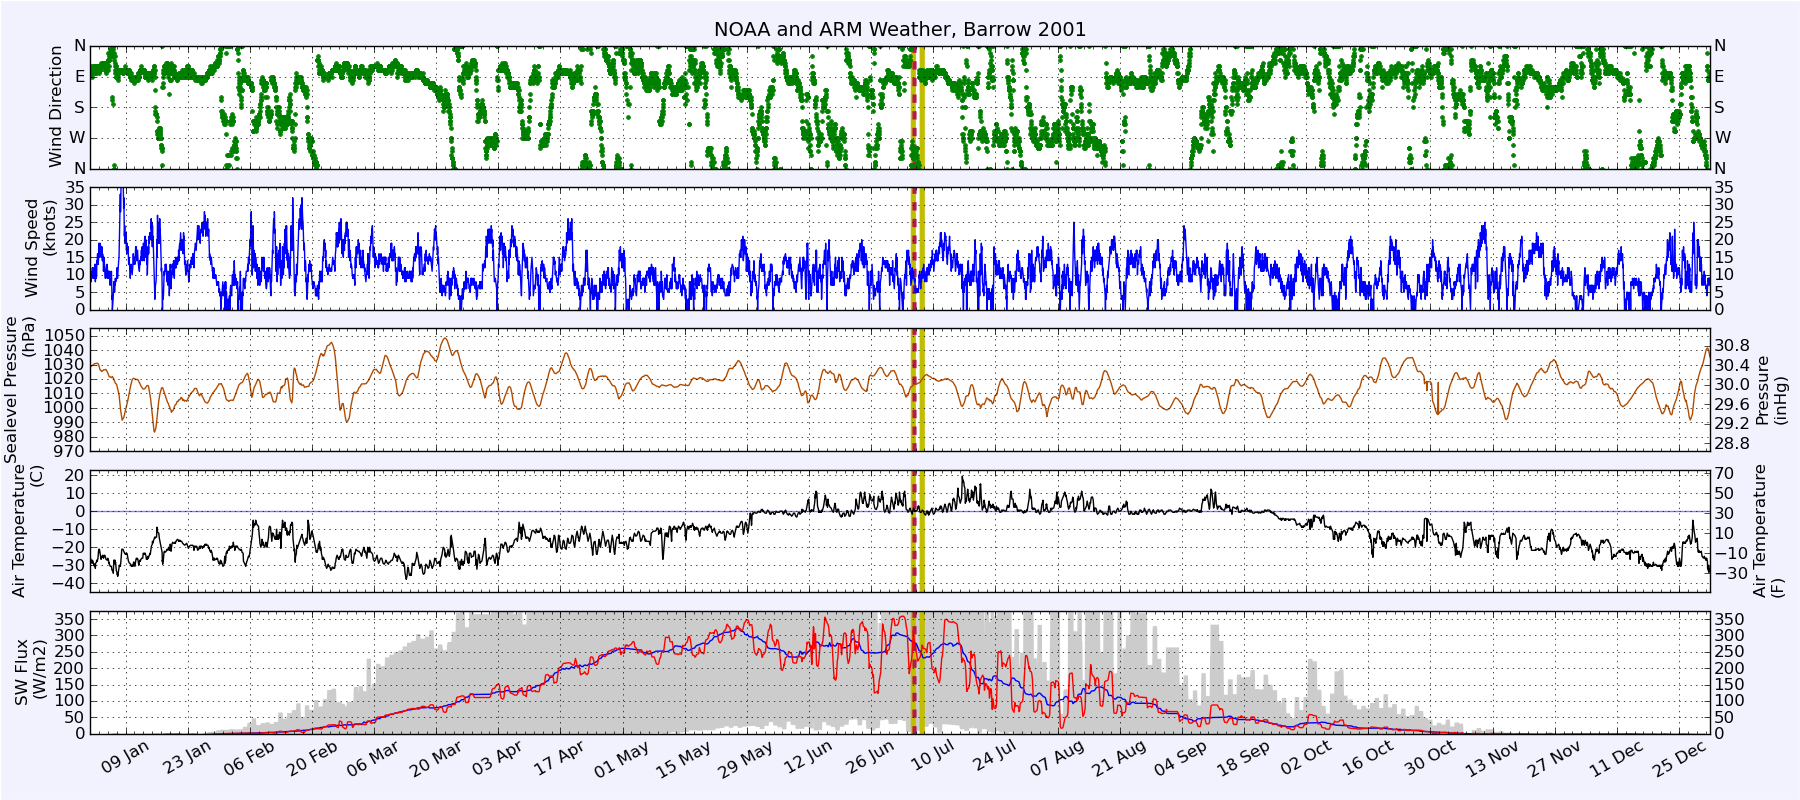
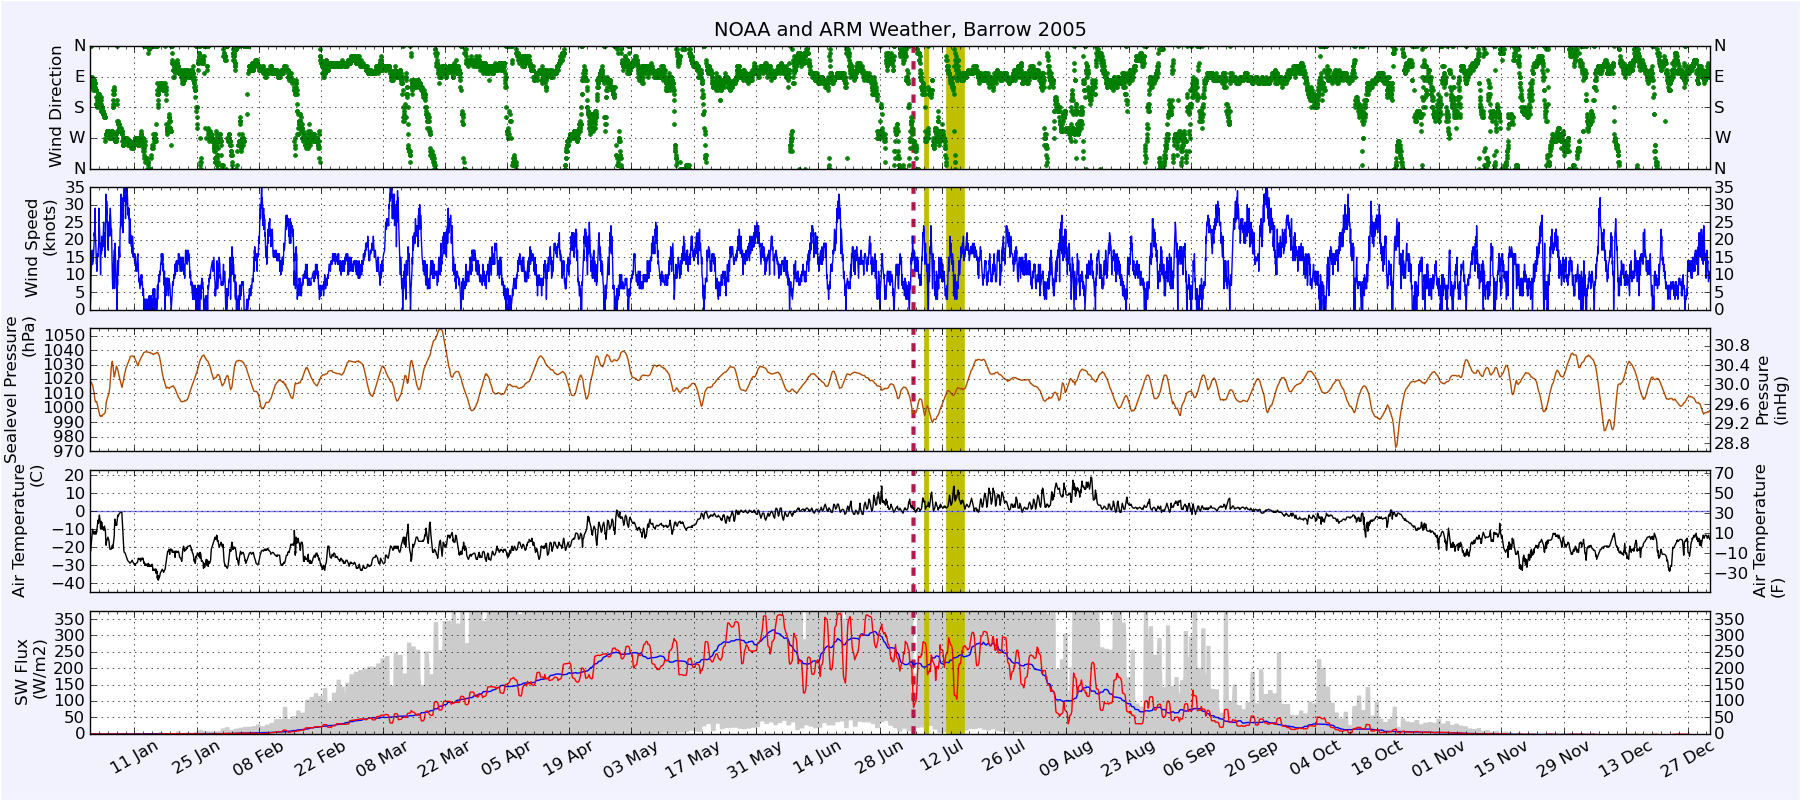
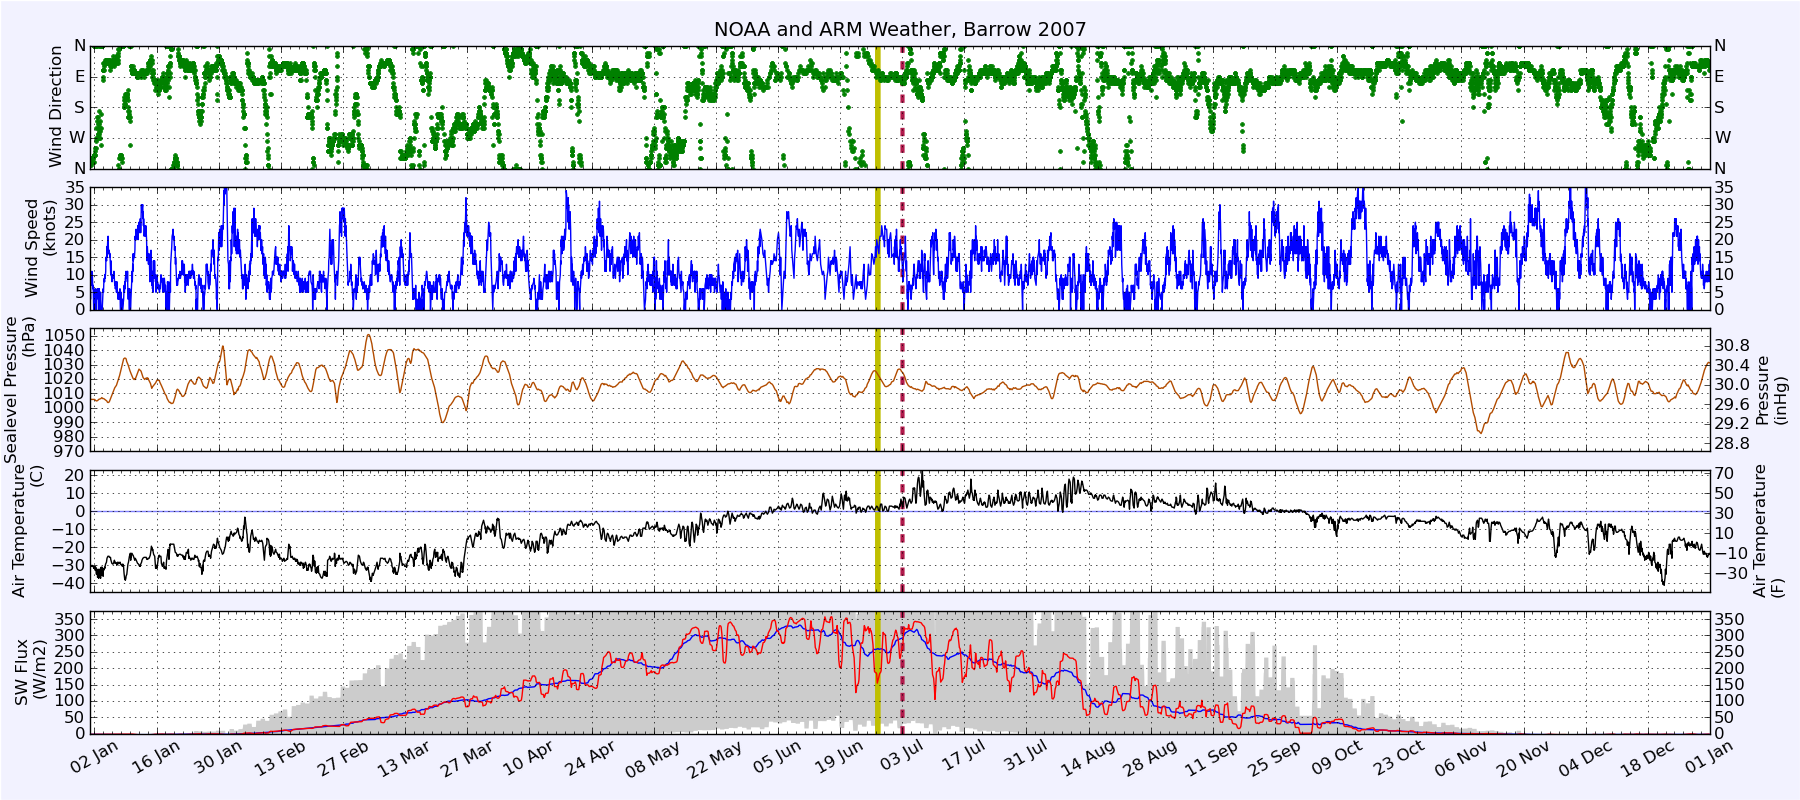
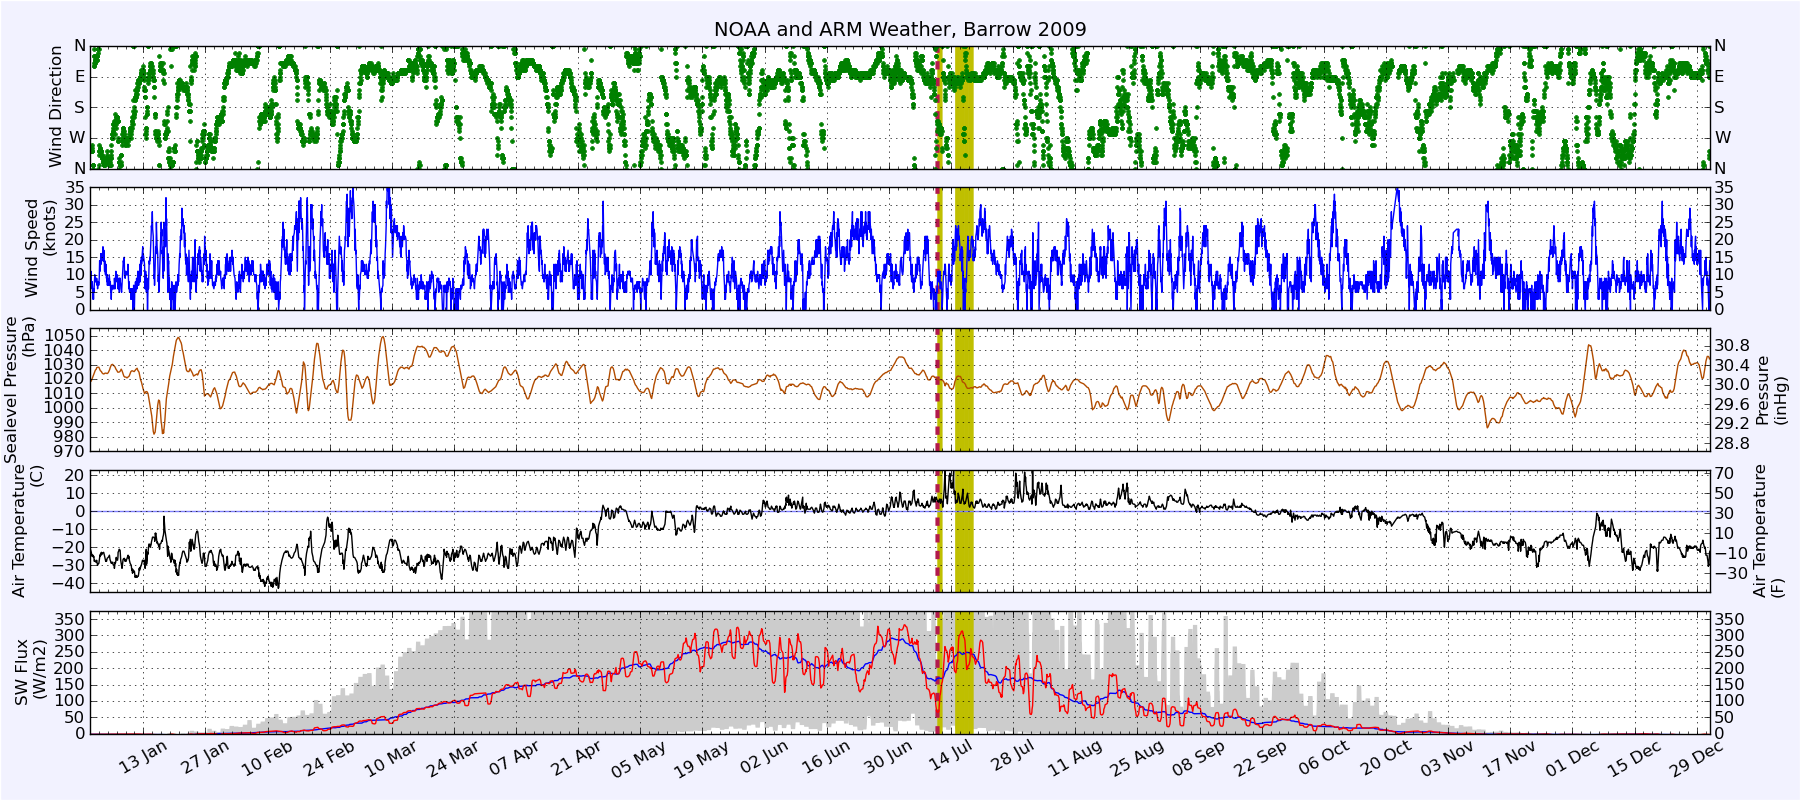
Barrow is generally windy (15 knots) with winds predominantly from NE (i.e., along-shore or slightly off-shore). However, it is exposed to pressure systems that pass about every 3 to 7 days. They expose the ice to winds from all directions and cause the sea level to rise and fall over a range of 1 m throughout the season (compare this to the tidal range of 0.2 m); see the plots on the Sea Ice Mass Balance page for this year's history and sealevel_pressure.mp4 for recent regional (North Pacific, Siberia, Arctic Ocean) pressure systems (NCEP/NCAR and GFS data) and Barrow winds (NOAA data).
The graphic above shows the recorded wind speed, direction, air pressure and sealevel since May. The first three parameters are courtesy NOAA and measured at the Barrow airport. Sealevel is recorded at the SIZONet Sea Ice Mass Balance Site. The gray lines are forecasts. Wind and air pressure information are provided by the UAF Mesoscale Modeling and Applications Group based on their weather forecasts with a WRF regional weather forecast model. The sealevel expectation is based on our heuristics using the development of wind speed, direction and pressure shown above.
We expect that break-up of landfast sea ice is most likely on a day with off-shore winds (i.e., from SE) following conditions characteristic for high sealevel (i.e., low pressure raising and winds from SW) after the ice has been sufficiently preconditioned by solar heating.
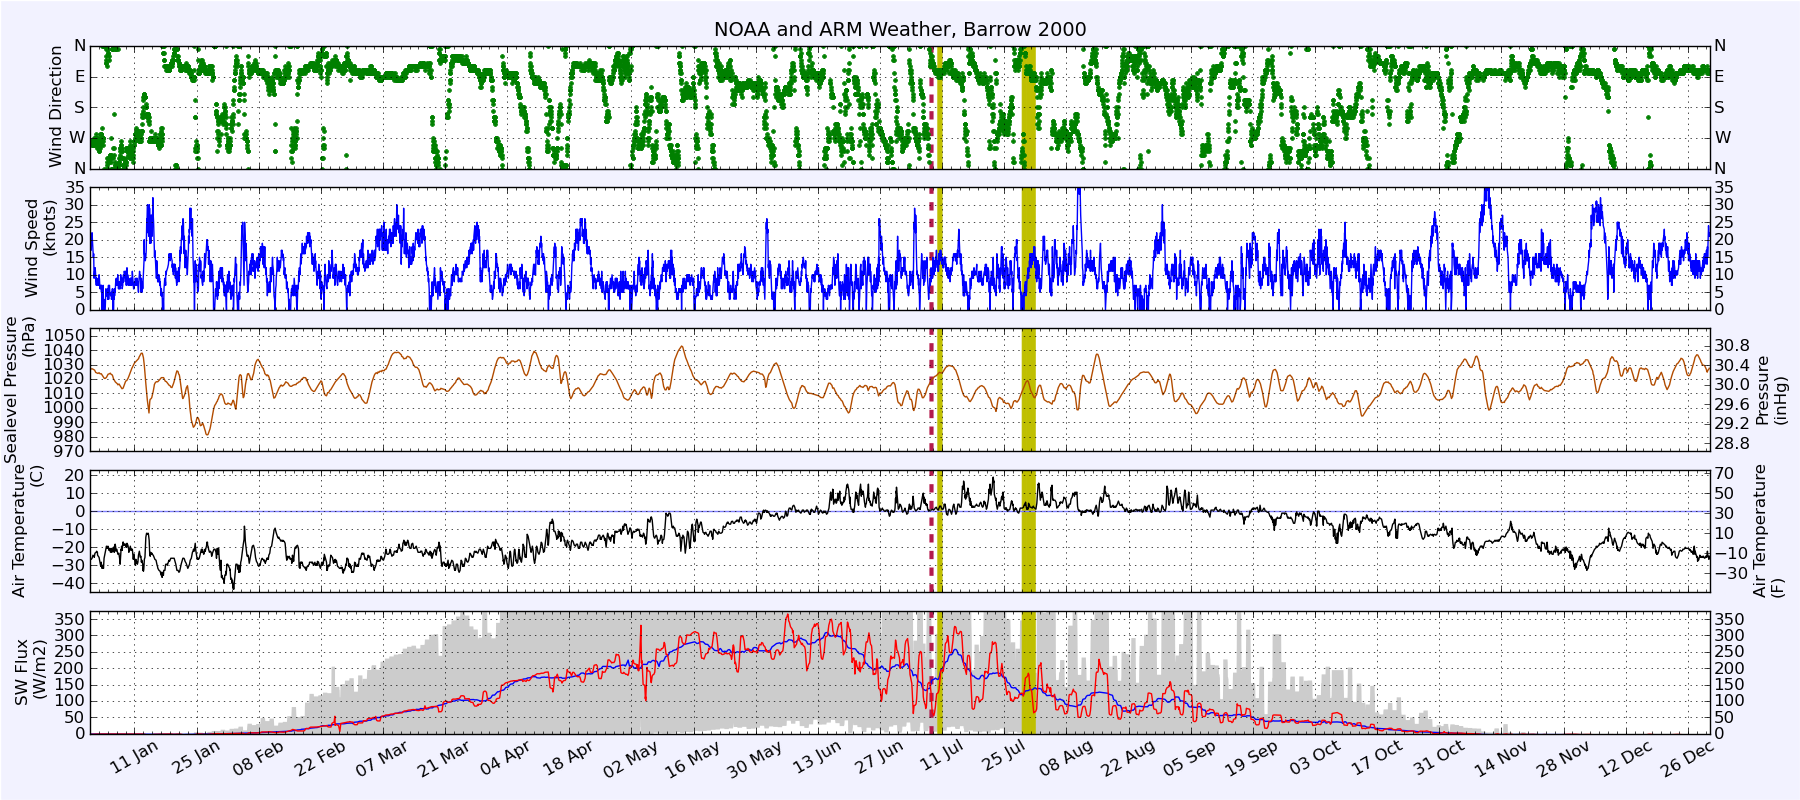
Recent Years
Figures are UTC, comments refer to local time in Barrow. Wind speed includes gusts. Downwelling SW flux is plotted as both daily and weekly average. Sealevel air pressure movies (approx. 1 MB each) use NCEP reanalysis data and NOAA wind data from the Barrow airport.
Overview animations (mp4) of NCEP data are provided here of daily mean sealevel pressure (scale is missing: it's from 970 hPa to 1060 hPa)superimposed with daily mean 2 m air temperature anomaly with respect to the monthly running mean (dark: ΔT<-5°C (indicating a cold snap); mid-gray: -5°C<ΔT<5°C; light: 5°C<ΔT (indicating a hot spell)): 2000/1, 2001/2, 2002/3, 2003/4, 2004/5, 2005/6, 2006/7, 2007/8, 2008/9.
 see also year 2000 |
2000 webcam at NARL Air pressure June, July, August: mp4 MMAB sea ice concentration: mp4
|
 see also year 2001 |
2001 webcam at NARL Air pressure June, July, August: mp4 MMAB sea ice concentration: mp4
|
 see also year 2002 |
2002 webcam at NARL Air pressure June, July, August: mp4 MMAB sea ice concentration: mp4
|
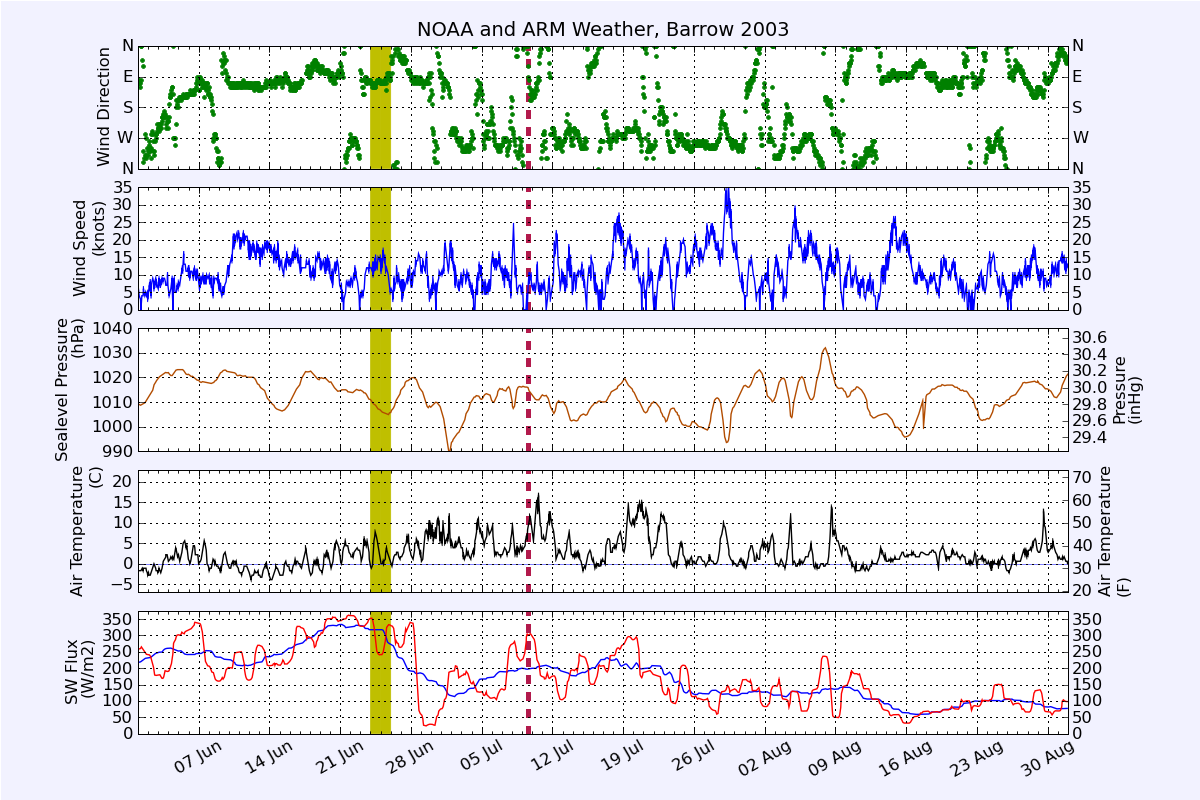 see also year 2003 |
2003 webcam at NARL Air pressure June, July, August: mp4 MMAB sea ice concentration: mp4
|
 see also year 2004 |
2004 RADAR at NARL, webcam at NARL Air pressure June, July, August: mp4 MODIS timelapse: mp4 MMAB sea ice concentration: mp4
|
 see also year 2005 |
2005 RADAR at NARL, webcam at NARL Air pressure June, July, August: mp4 MODIS timelapse: mp4 MMAB sea ice concentration: mp4
|
 see also year 2006 |
2006 RADAR, webcam downtown Air pressure June, July, August: mp4 MODIS timelapse: mp4 MMAB sea ice concentration: mp4
|
 see also year 2007 |
2007 RADAR, webcam downtown Air pressure June, July, August: mp4 MODIS timelapse: mp4 MMAB sea ice concentration: mp4
|
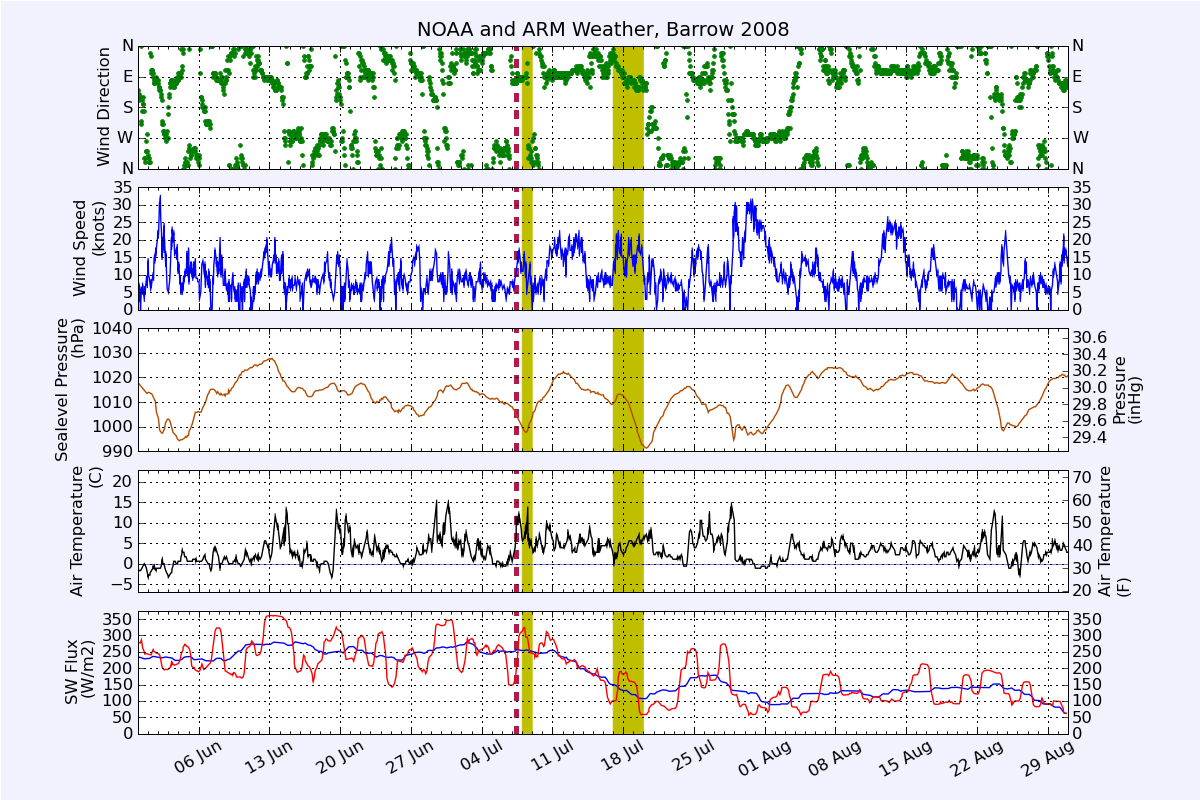 see also year 2008 |
2008 RADAR, webcam downtown Air pressure June, July, August: mp4 MODIS timelapse: mp4 MMAB sea ice concentration: mp4
|
 see also year 2009 |
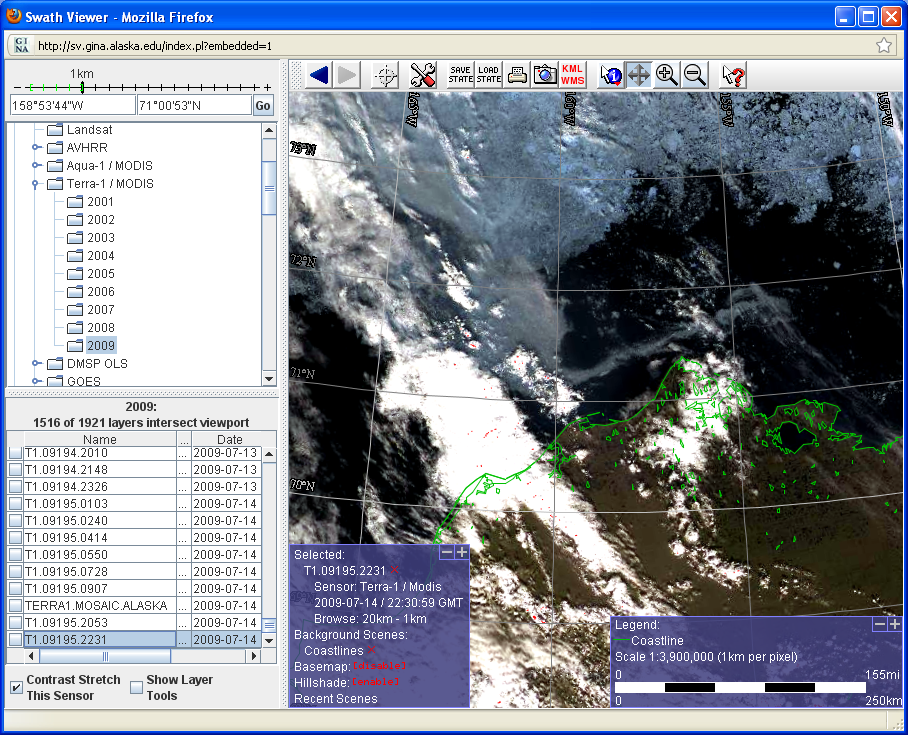
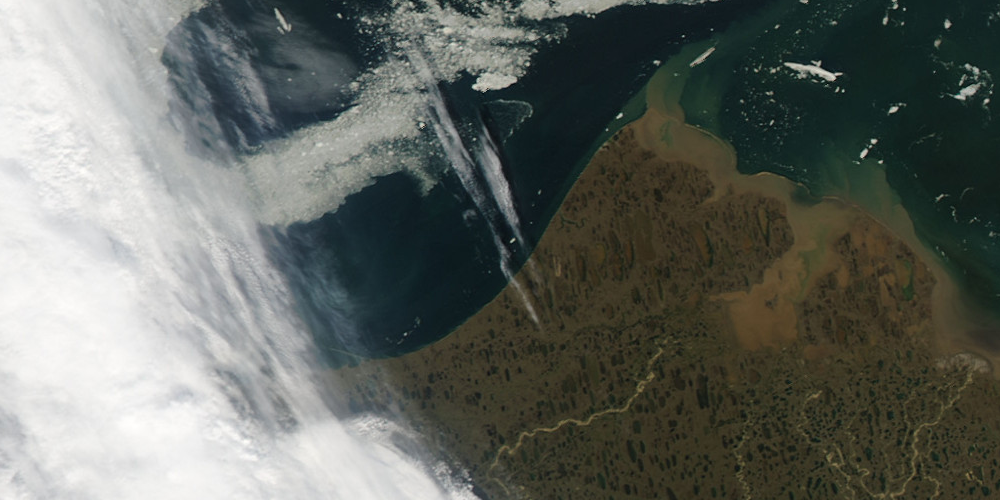
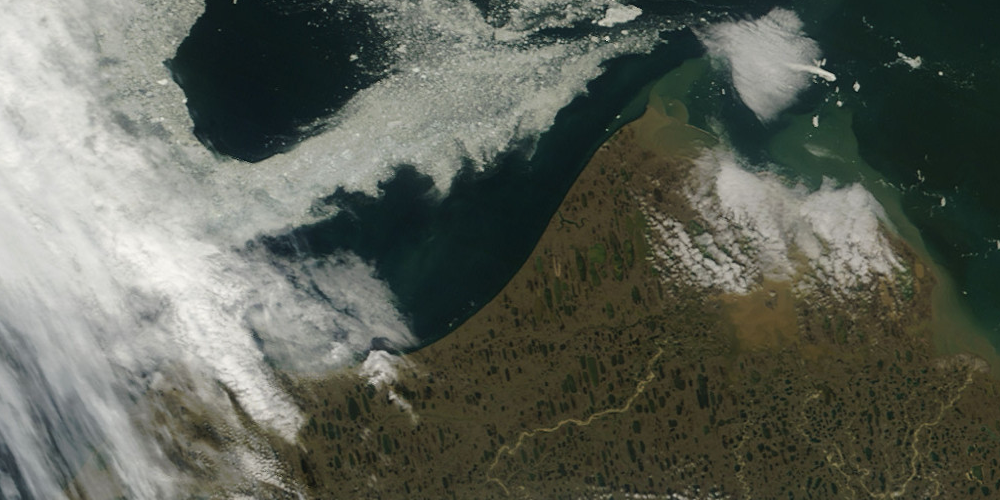
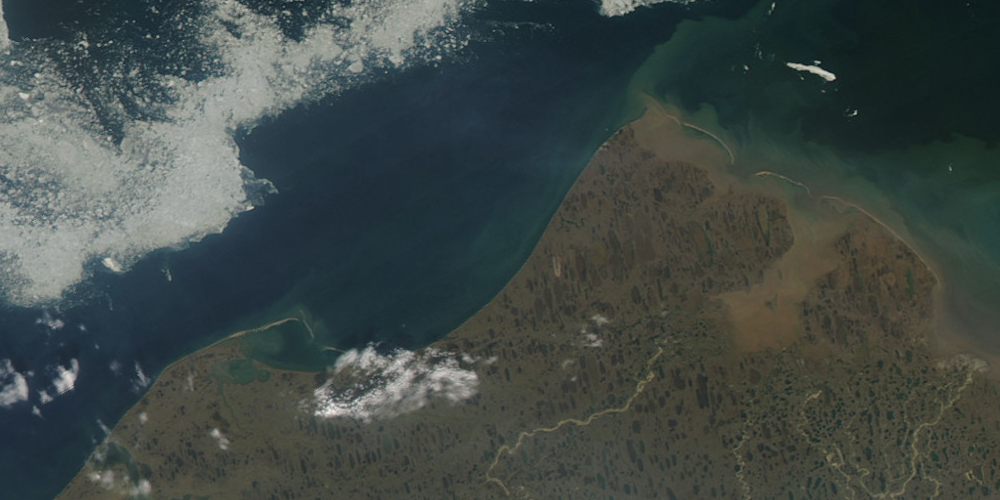
2009 RADAR, webcam downtown Air pressure June–current: mp4 MODIS timelapse: Barrow regional mp4, Arctic cropped mp4 MMAB sea ice concentration: mp4
|
Methods
WRF Model
The weather forecast is produced with a meso-scale (i.e. regional) WRF model computed by the Mesoscale Modeling and Applications Group of Jing Zhang at the Arctic Region Supercomputing Center (ARSC). The model is forced by global NCEP GFS 16-day weather predictions. WRF grid size is 25 km.
For the prediction of the downwelling shortwave (SW) radiation we calculate cloud transmissivity from the reported WRF absorbed SW radiation, WRF ground albedo, and expected clear sky radiation. We use the cloud transmissivity, expected clear sky radiation, and actual ground albedo at the ARM facility (simplified to: 0.61 until June 9, 0.20 since) to calculate the expected downwelling SW radiation.
For the prediction of the downwelling shortwave (SW) radiation we calculate cloud transmissivity from the reported WRF absorbed SW radiation, WRF ground albedo, and expected clear sky radiation. We use the cloud transmissivity, expected clear sky radiation, and actual ground albedo at the ARM facility (simplified to: 0.61 until June 9, 0.20 since) to calculate the expected downwelling SW radiation.
For the sealevel forecast we use hourly mean data of surface air pressure, wind speed and direction that are delivered by the WRF model directly.
Albedo at the ARM site
We determine the ground albedo at the ARM site from the upward and downward looking shortwave radiometers SKYRAD and GNDRAD, respectively. 60 s-averages provided by ARM are converted to hourly averages; the ground albedo is calculated for each hour dividing the GNDRAD reading by the SKYRAD reading; in order to determine the onset of melt we determine the median of the hourly albedo values calculated from 2000Z to 0159Z for each day Alaska time zone
Solar Radiation
We use ARM data whenever possible and estimate the incoming shortwave radion for days without measurements.
In order to estimate the shortwave flux incident on the ground, we use hourly NOAA weather observations and clear-sky radiation expected from the sun declination.
Reported cloud layers are superimposed assuming random overlap. The categories of cloud cover fractions reported by NOAA are quite coarse and we assume the lower bound for each category. Further, if complete cloud coverage is reported below 1000 ft we treat this as 80% cloud coverage. In addition, clouds below 2000 ft are assumed thick, and even more so if the ground visibility is below 3 miles. An effective attenuation is calculated based on cloud coverage, assumed cloud thickness, and tundra ground albedo (0.61 before 2 June; then 0.4; and 0.2 starting 9 June).
Sealevel
Sealevel anomaly (i.e., deviation from "normal") is modeled as a superposition of three constituents: a tidal cycle due to sun and moon; hydrostatic sealevel changes due to air pressure changes; and sealevel changes correlated with winds. The algorithm is tuned to sealevel observations made in 2009 and inspired by an analysis of the evolution of the surface pressure fields within about 1000–2000 km of Barrow.
Tidal components (12h: M2, S2, N1; 24h: K1, O1, P1; 14-day: MF; 28-day: MM) were fitted to mass balance site sealevel data from January to May 2009. These are linearly superimposed with the output of four critically damped (i.e. non-oscillating) harmonic oscillators. Each oscillator is driven by a deflection (in m) that is derived from air pressure (pair; reference pressure is p0), wind speed (v in knots) and direction (φ in degrees, given by NOAA in steps of 10°) as follows:
- -(pair-p0)/(g ρwater) (this is -0.1 m for every 10 hPa); resonance period 2.2 days
- -(pair-p0)/(g ρwater) (this is -0.1 m for every 10 hPa); resonance period 30 days
- if wind comes from SE (65°<φ<135°): -0.3 m * min(v, 14 knots)/(14 knots); resonance period 1 day
- if we are within one day of a pressure minimum AND the pressure is rising AND the wind speed decreases after the pressure minimum AND wind comes from South to West (155°<φ<285°): 0.4 m * min(v, 20 knots)/(20 knots); resonance period 1 day
Conditions 3. and 4. are implemented in fuzzy logic, i.e., in addition to "yes" and "no" we use a scale that includes "kind of" and "not really".
Acknowledgements
This project is a contribution to the 2009 Sea Ice Outlook (www.arcus.org/search/seaiceoutlook); it is based on work supported by the National Science Foundation under Grants No. OPP-0632398 and 0712673. Any opinions, findings and conclusions or recommendations expressed in this material are those of the author(s) and do not necessarily reflect the views of the National Science Foundation (NSF).
Data used for this sea ice outlook are obtained from the Atmospheric Radiation Measurement (ARM) Program sponsored by the U.S. Department of Energy, Office of Science, Office of Biological and Environmental Research, Environmental Sciences Division; NOAA ADDS; and the SIZONet Mass Balance Probe on landfast sea ice in Barrow. NCEP Reanalysis data provided by the NOAA/OAR/ESRL PSD, Boulder, Colorado, USA, from their Web site at http://www.cdc.noaa.gov/.
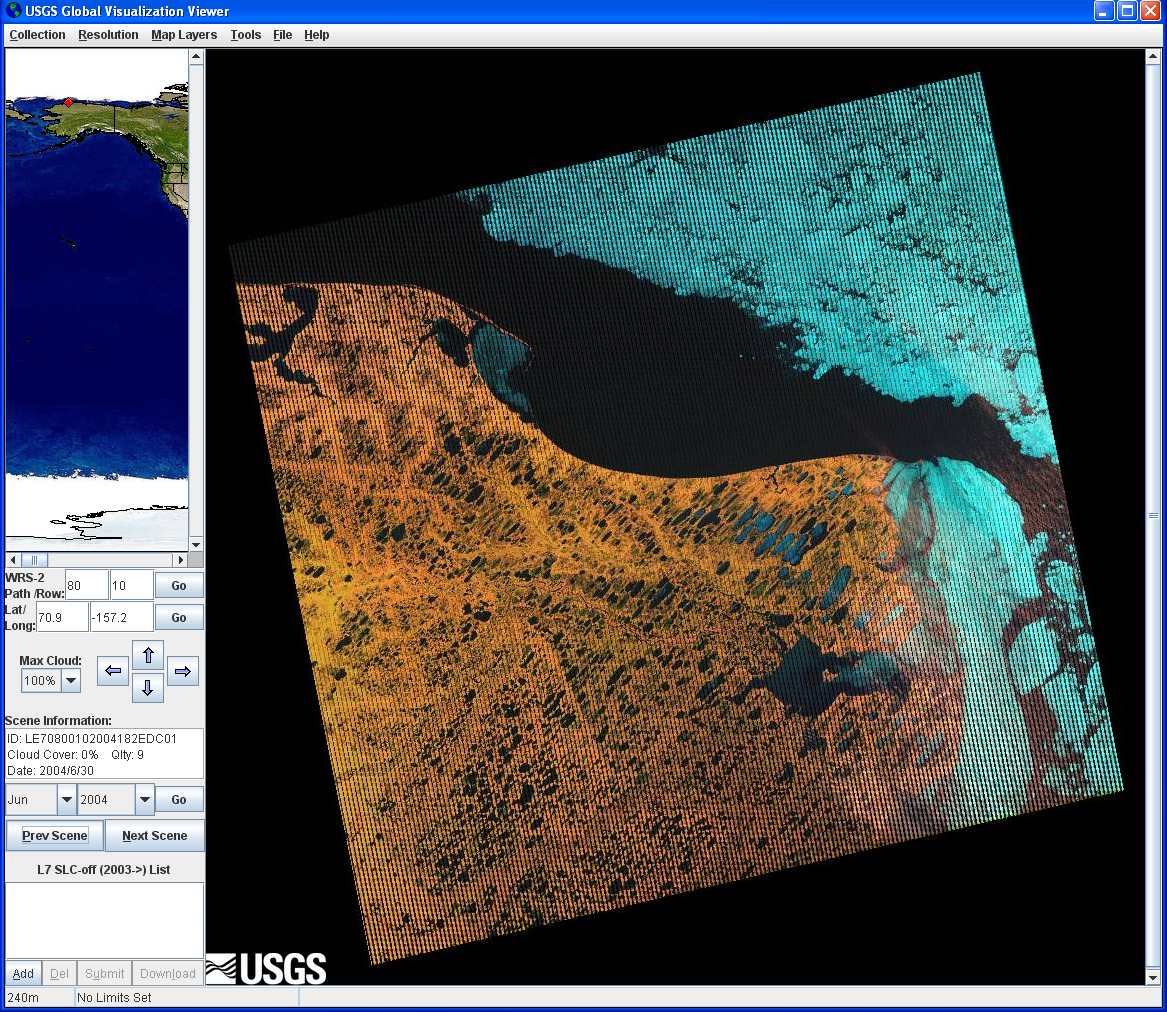
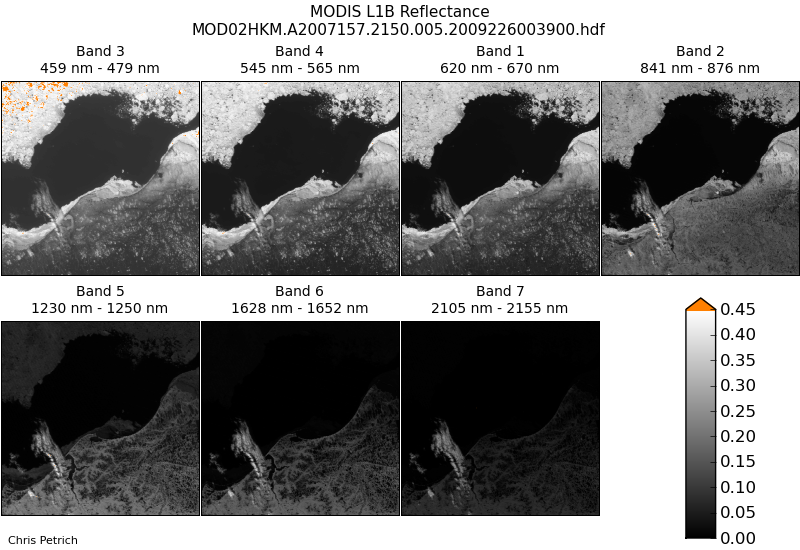
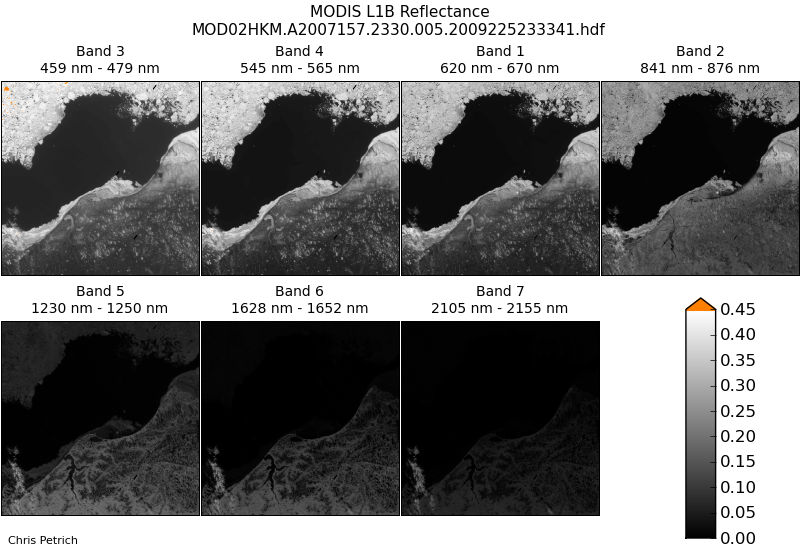
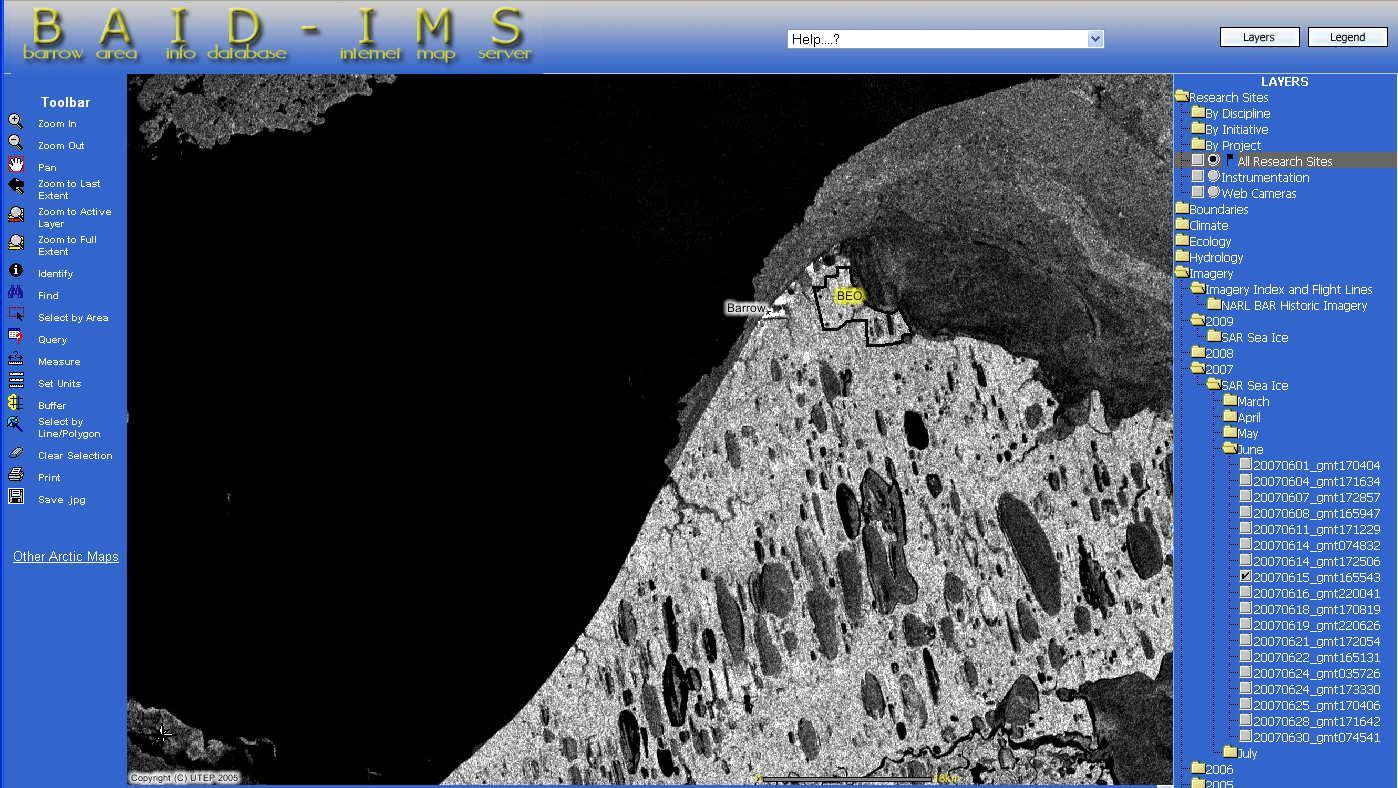
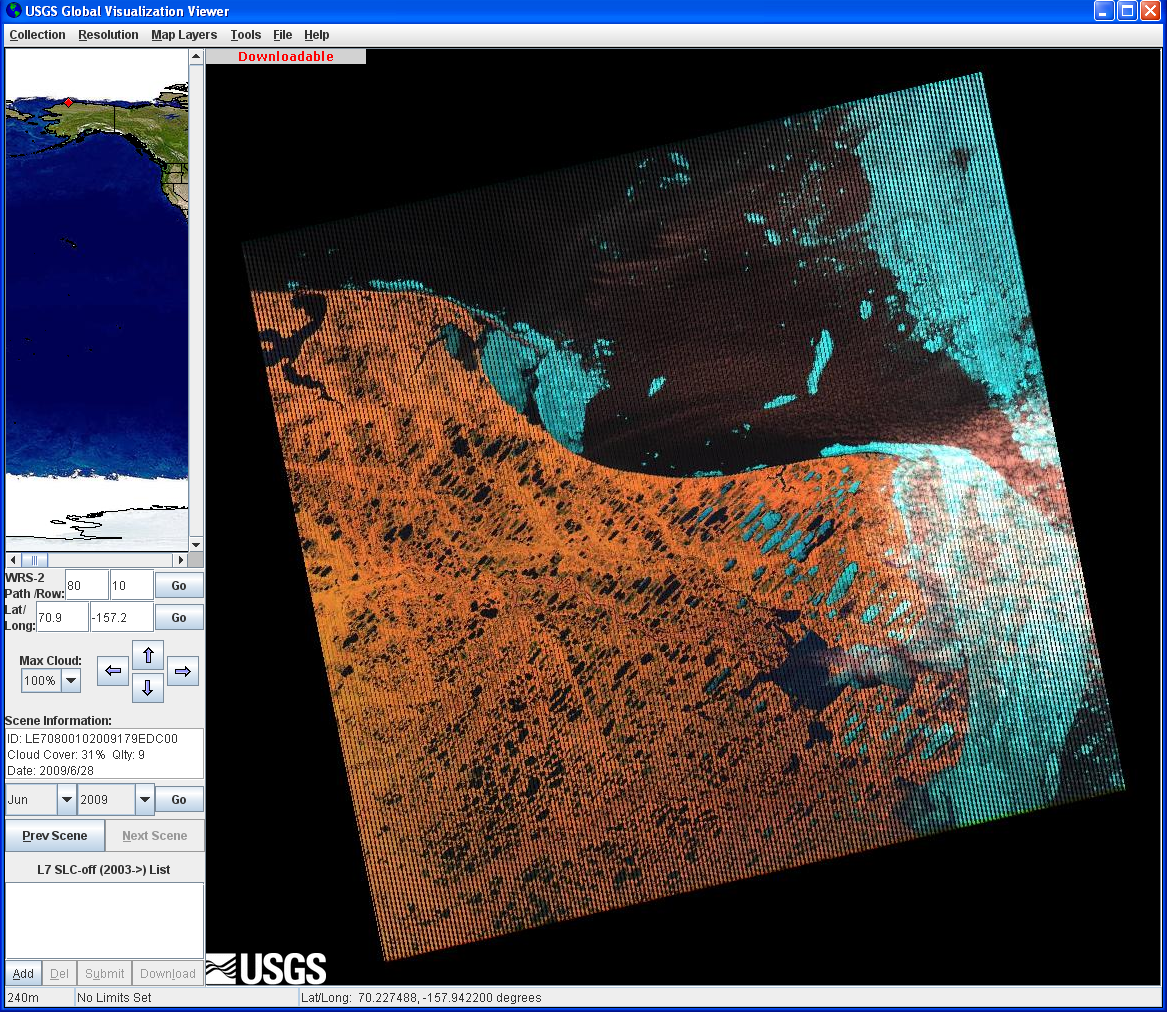
NOAA GFS forecast is obtained from http://www.nco.ncep.noaa.gov/. NCEP MMAB Automated Passive Microwave Sea Ice Concentration fields for Alaska were obtained from their ftp server, ftp://polar.ncep.noaa.gov/pub/ice/alaska/. Satellite images are provided by BAID-IMS (http://www.baidims.org/) the Alaska Satellite Facility URSA; USGS Global Visualization Viewer
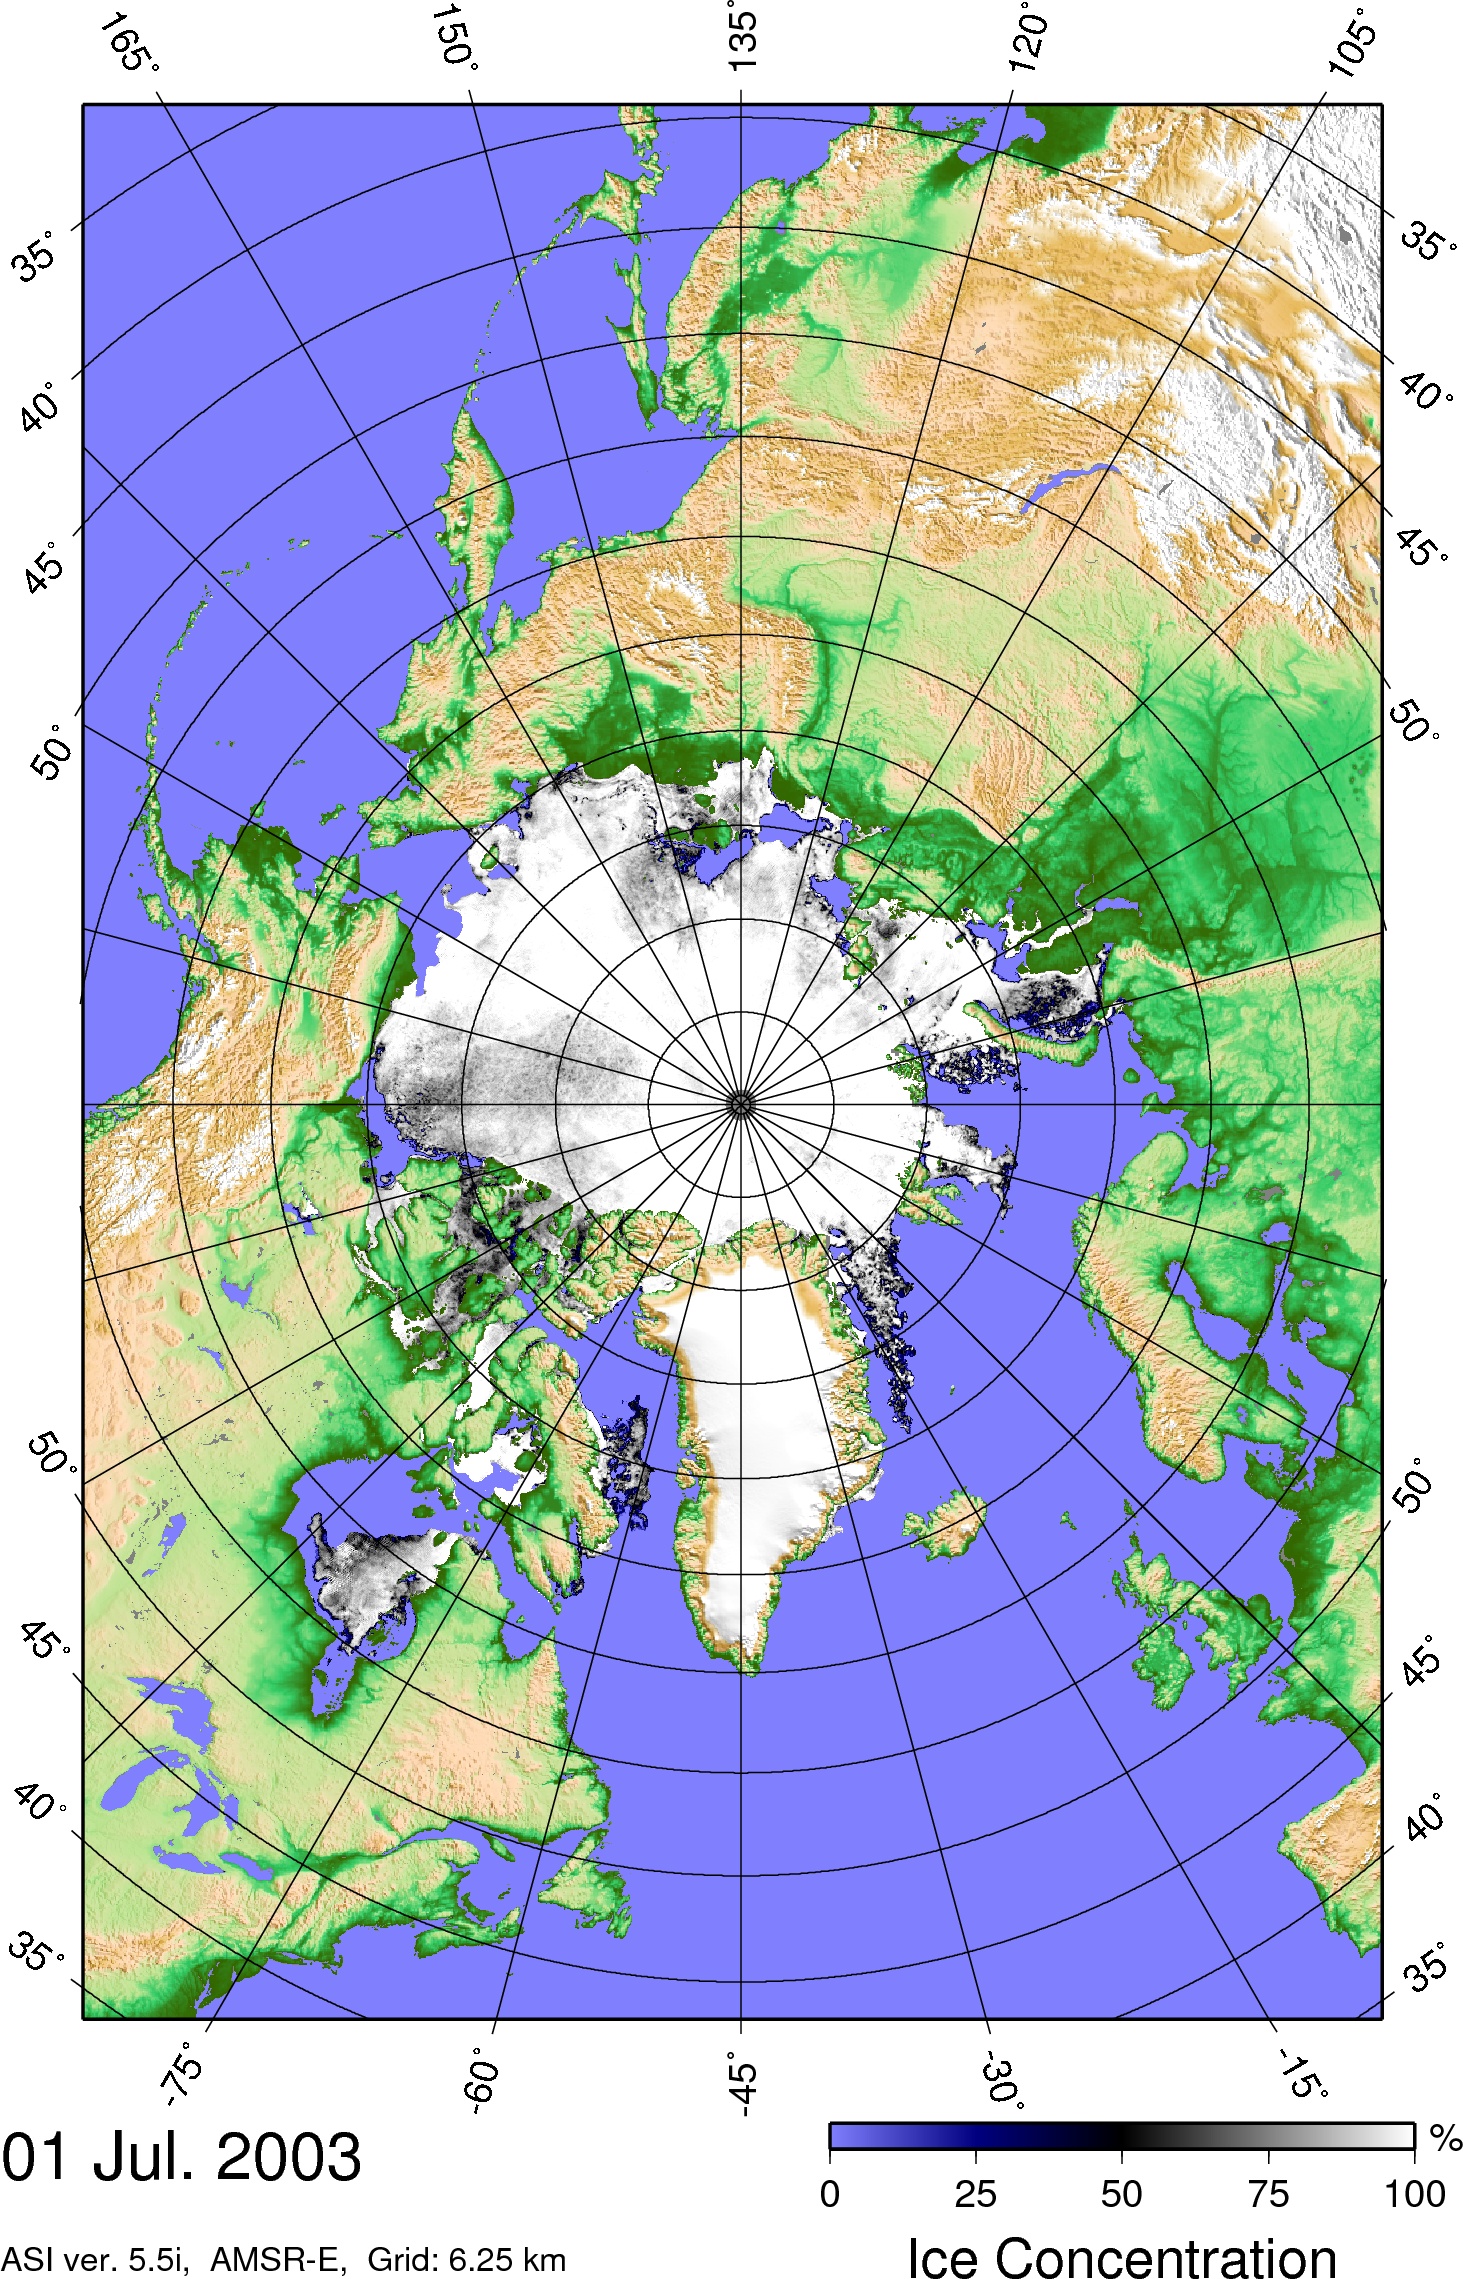
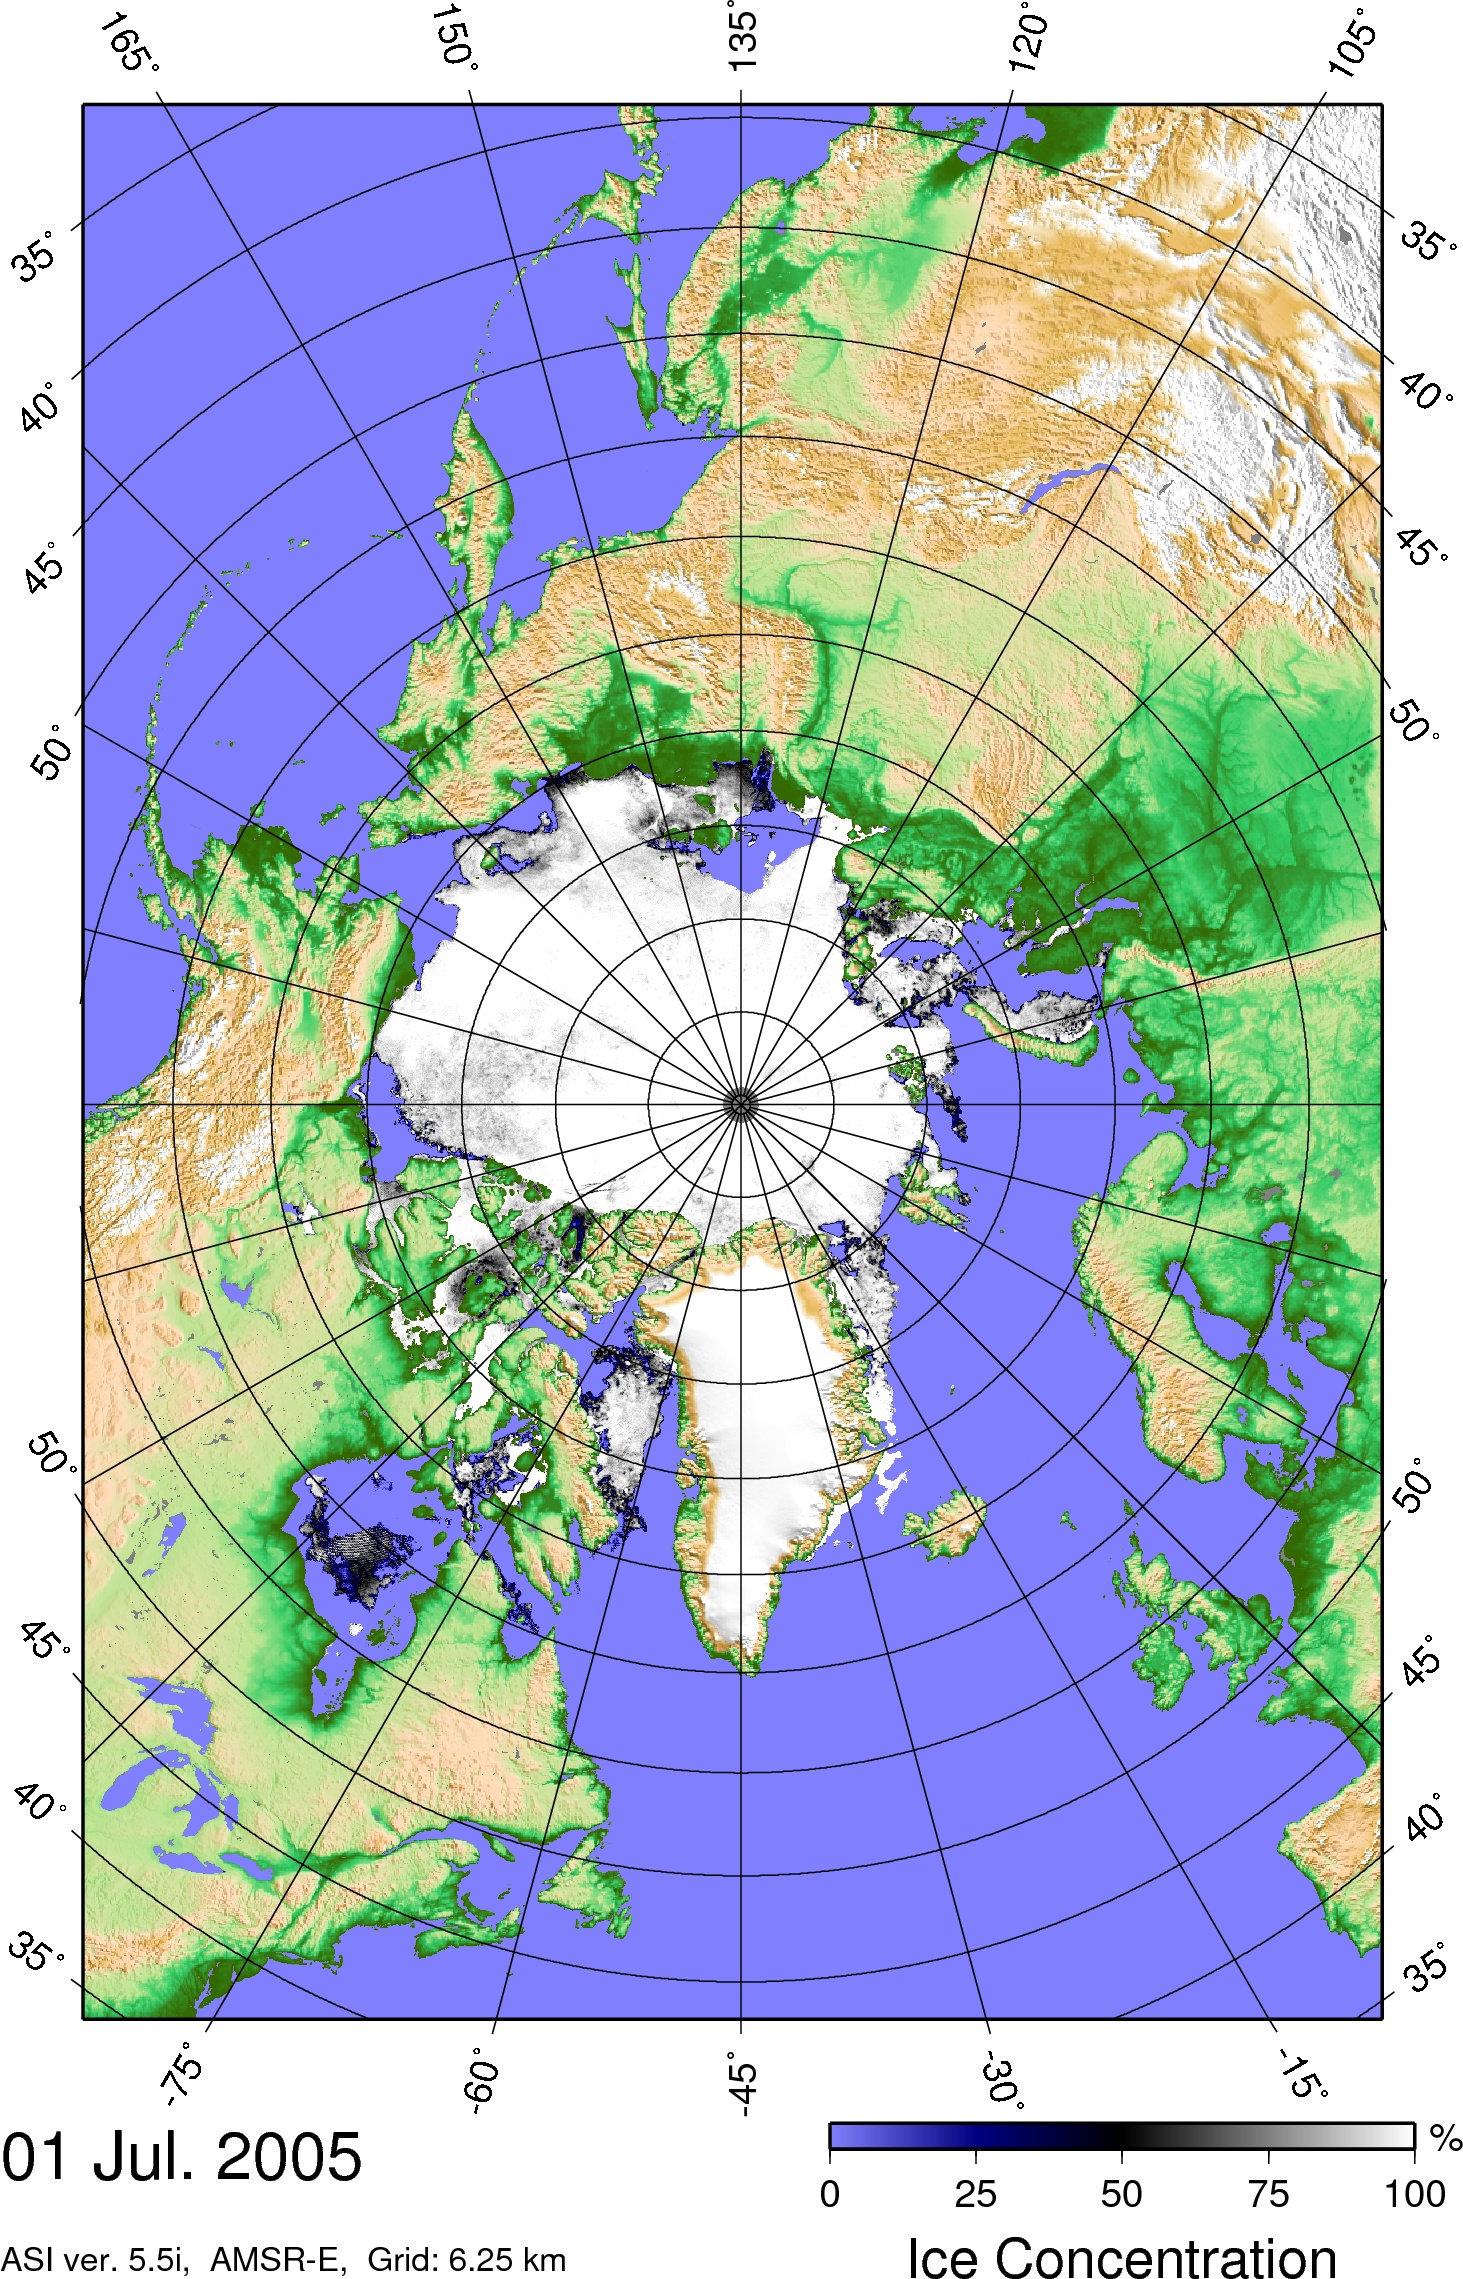
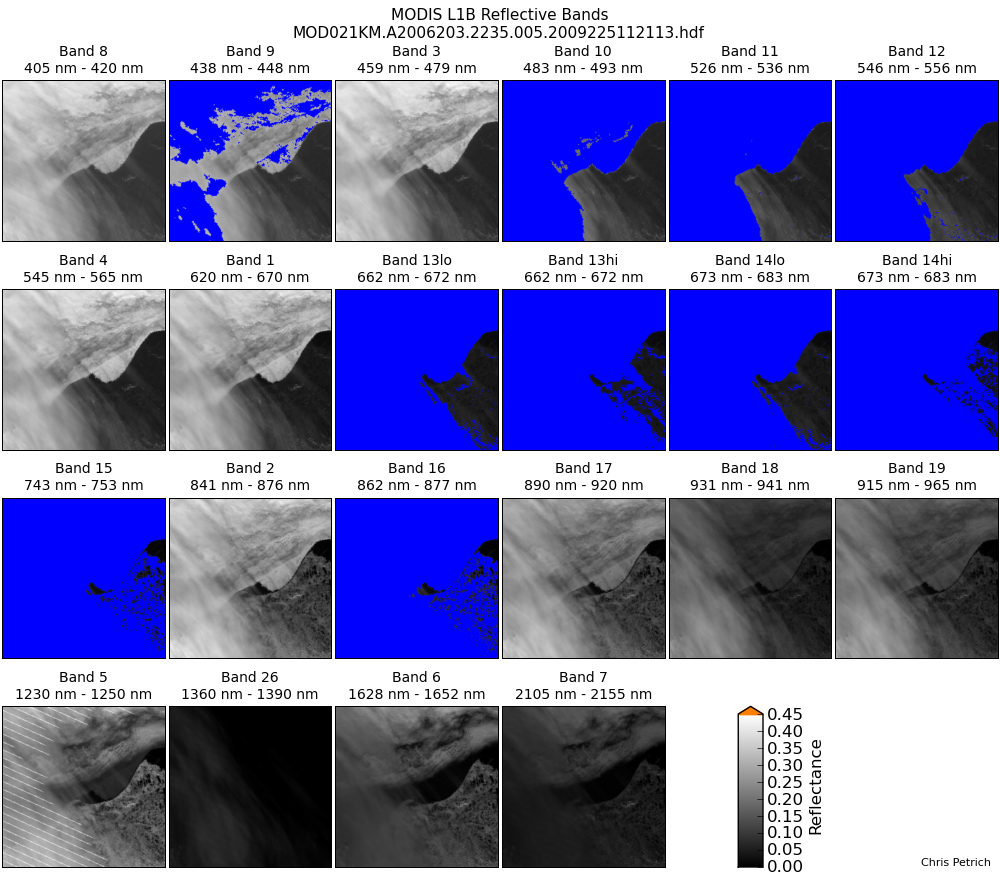
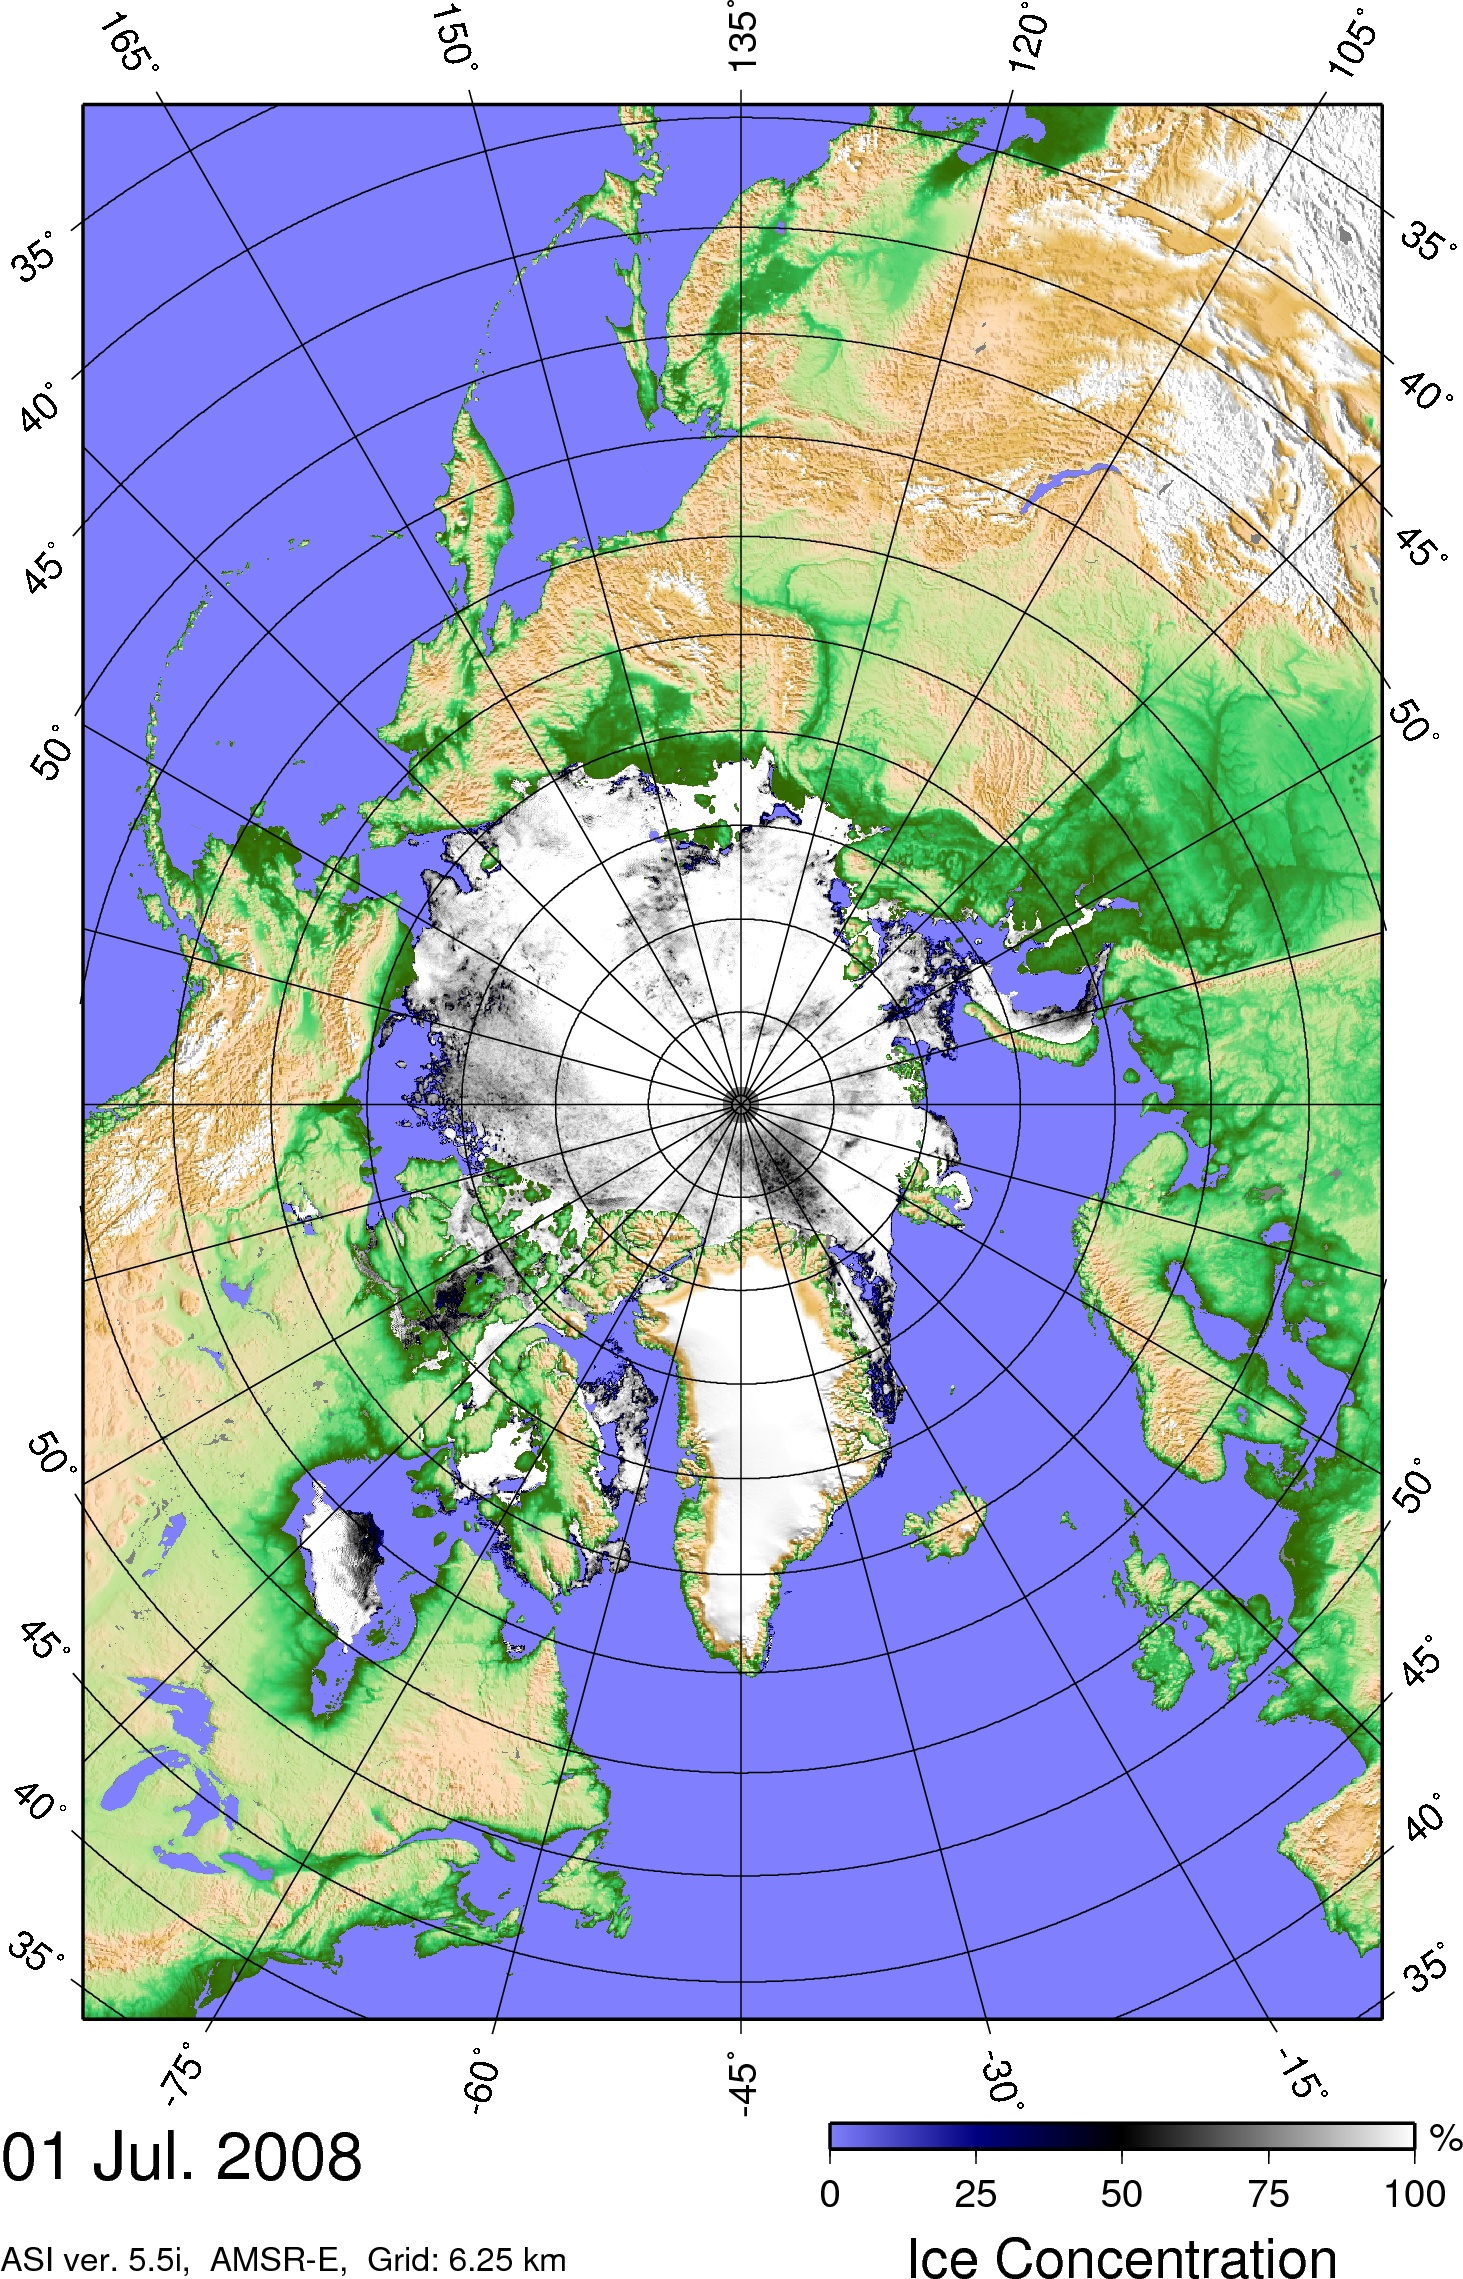
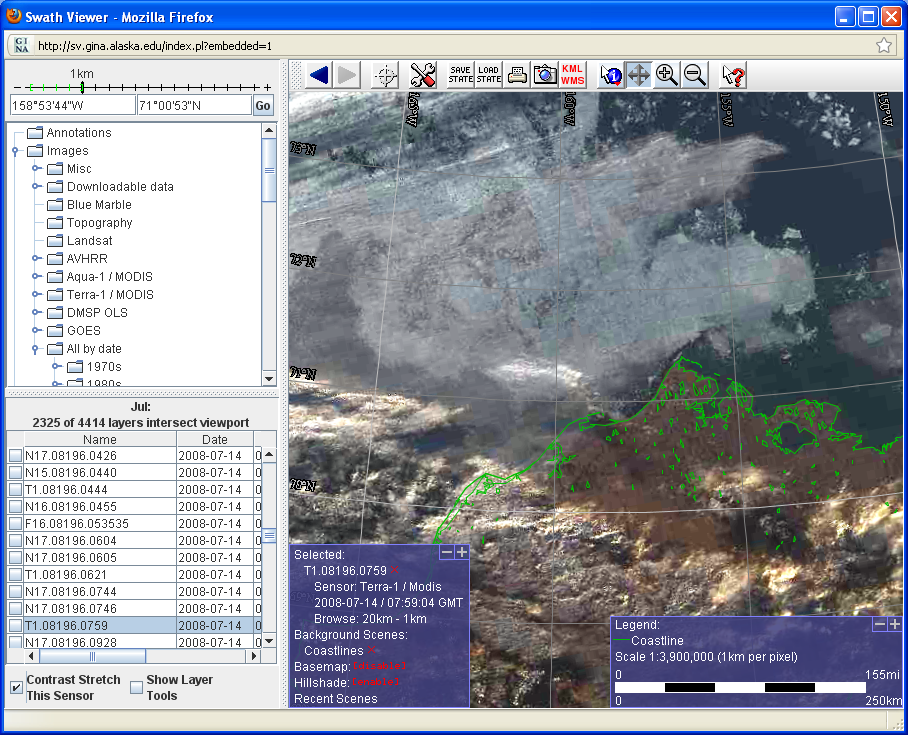
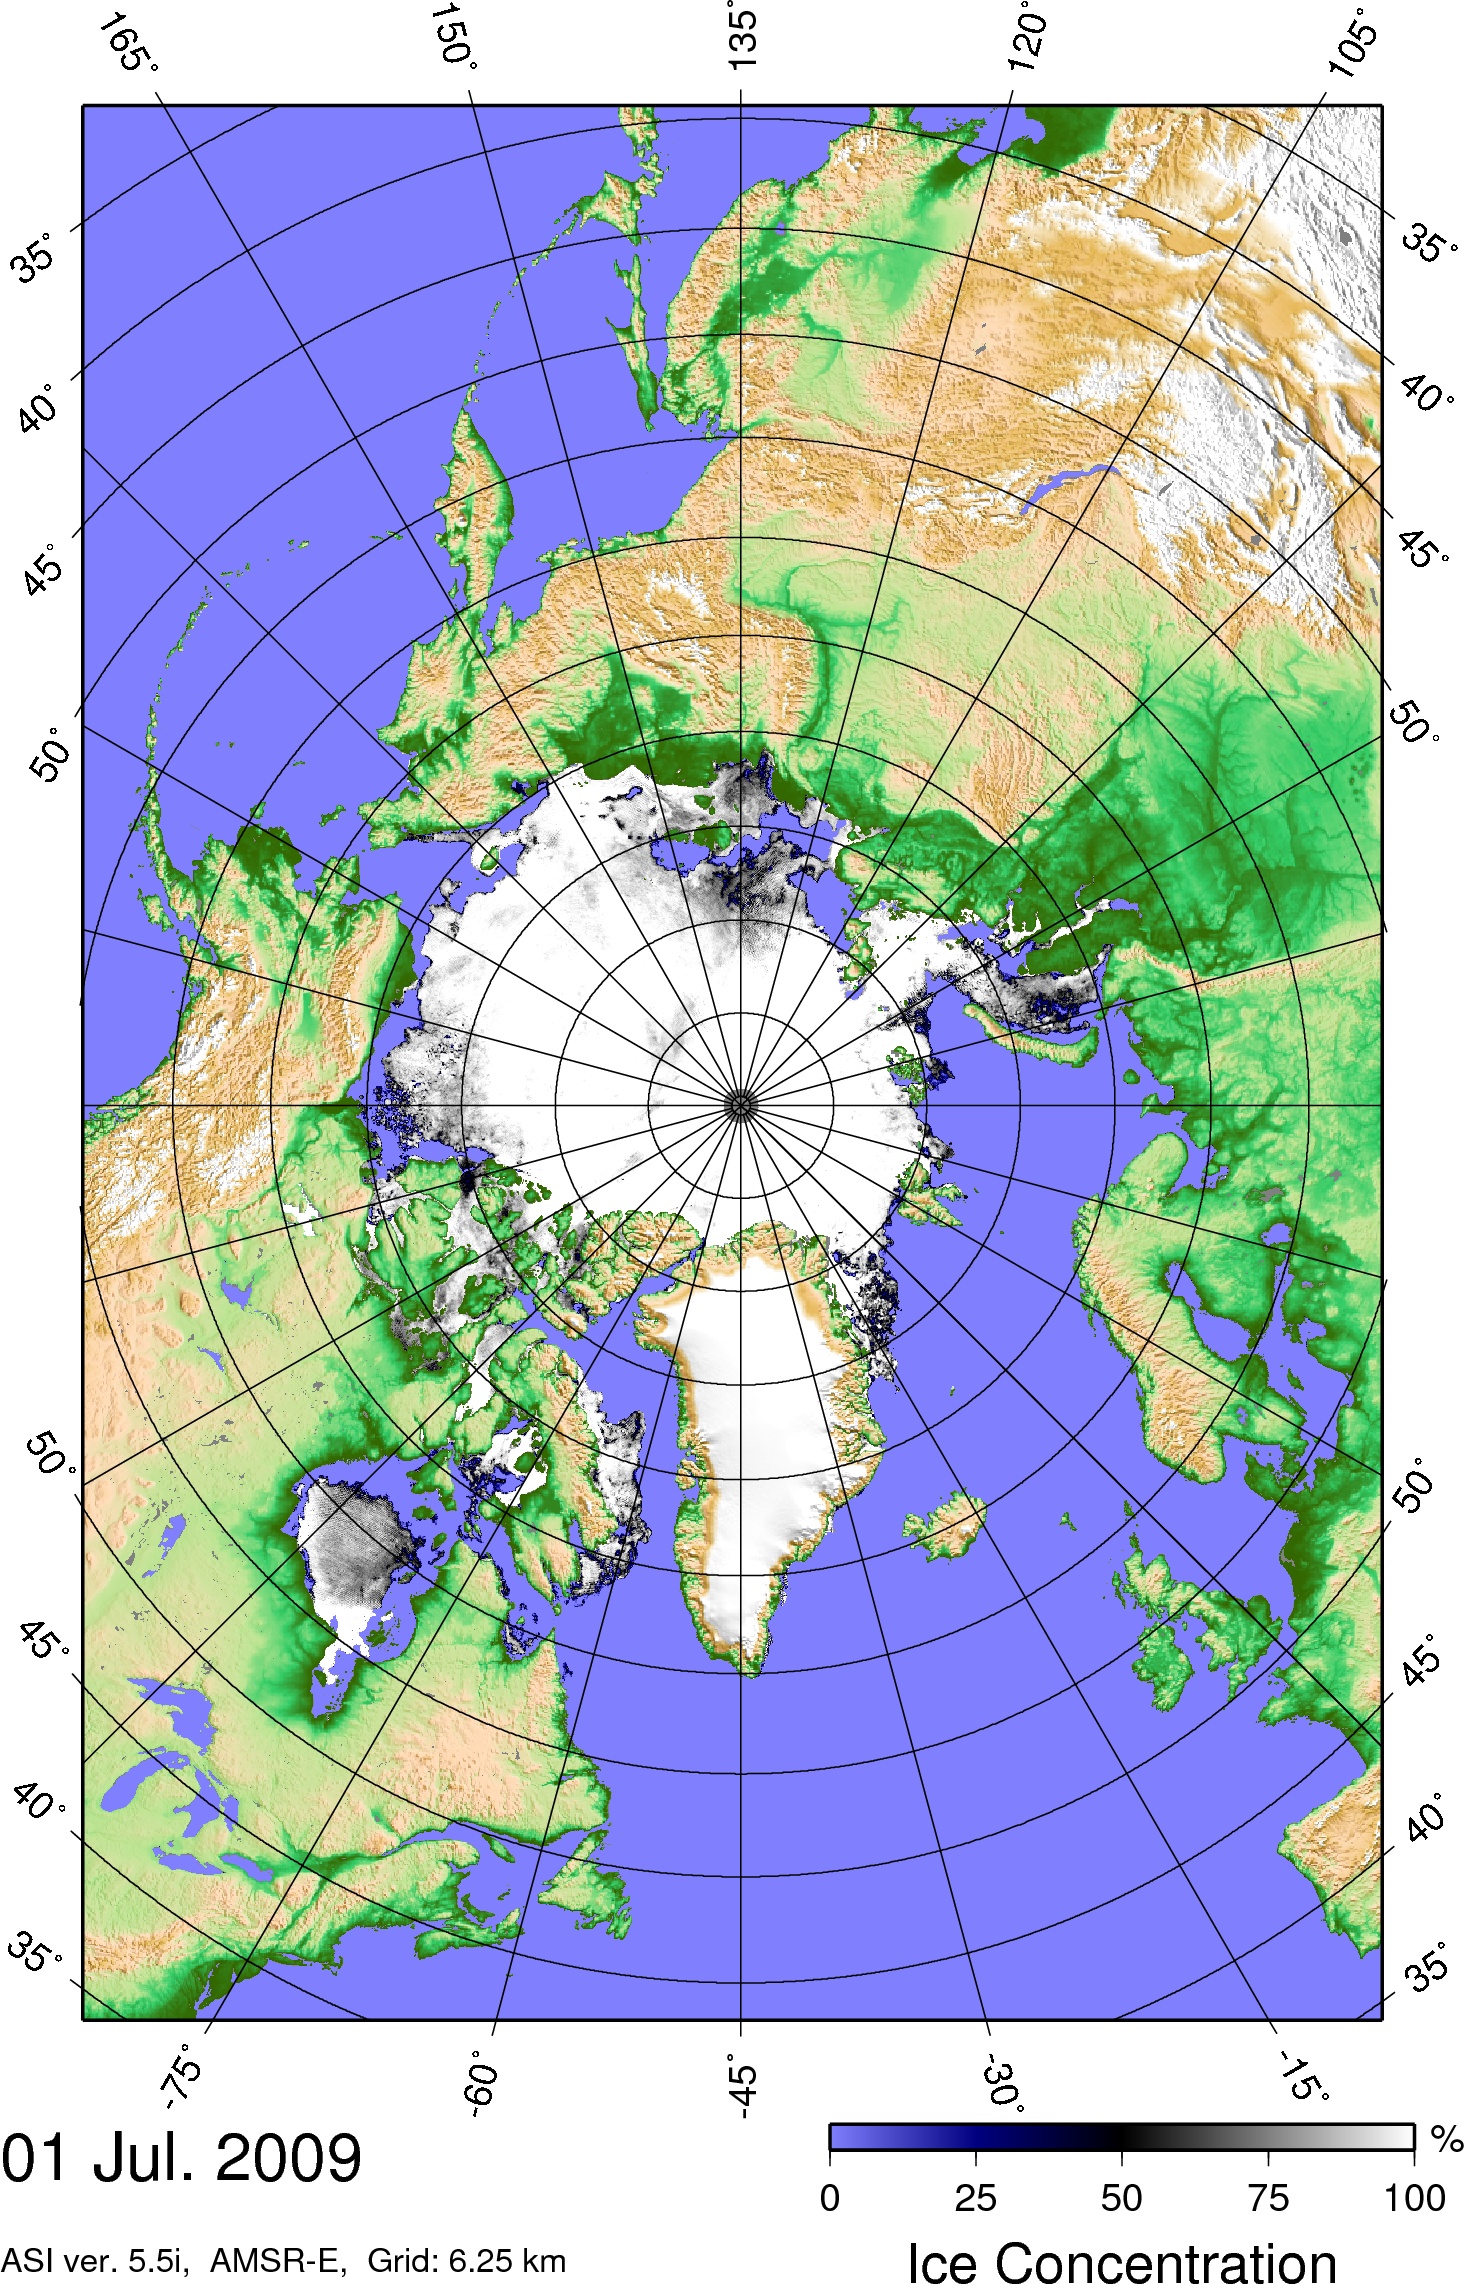
and Global Fiducials Library; GINA Swath Viewer; NASA MODIS Rapid Response Team. Processing of pre-2004 MODIS scenes was performed with the help of HDFLook and USGS MODIS Reprojection Tool – Swath (MRT Swath, swath2grid). AMSR-E data plots are prepared by Spreen, G., L. Kaleschke, and G. Heygster (2008), Sea ice remote sensing using AMSR-E 89 GHz channels, J. Geophys. Res., doi:10.1029/2005JC003384 and obtained from either the Institut für Umweltpysik, University Bremen at http://www.iup.uni-bremen.de:8084/amsr/amsre.html or University of Hamburg, Institute of Oceanography, Gunnar Spreen and Lars Kaleschke, http://www.ifm.zmaw.de/forschung/fernerkundung/meereis/amsre-sea-ice/.
Data processing is entirely based on freely available software, most notably the Ubuntu Linux distribution and Python with NumPy and matplotlib/basemap packages.
Contact: chris.petrich@gi.alaska.edu