| Sea Ice Group at the Geophysical Institute |

|
|
Barrow Sea Ice Thickness and Sea Level
Barrow Sea Ice Mass Balance Site 2012
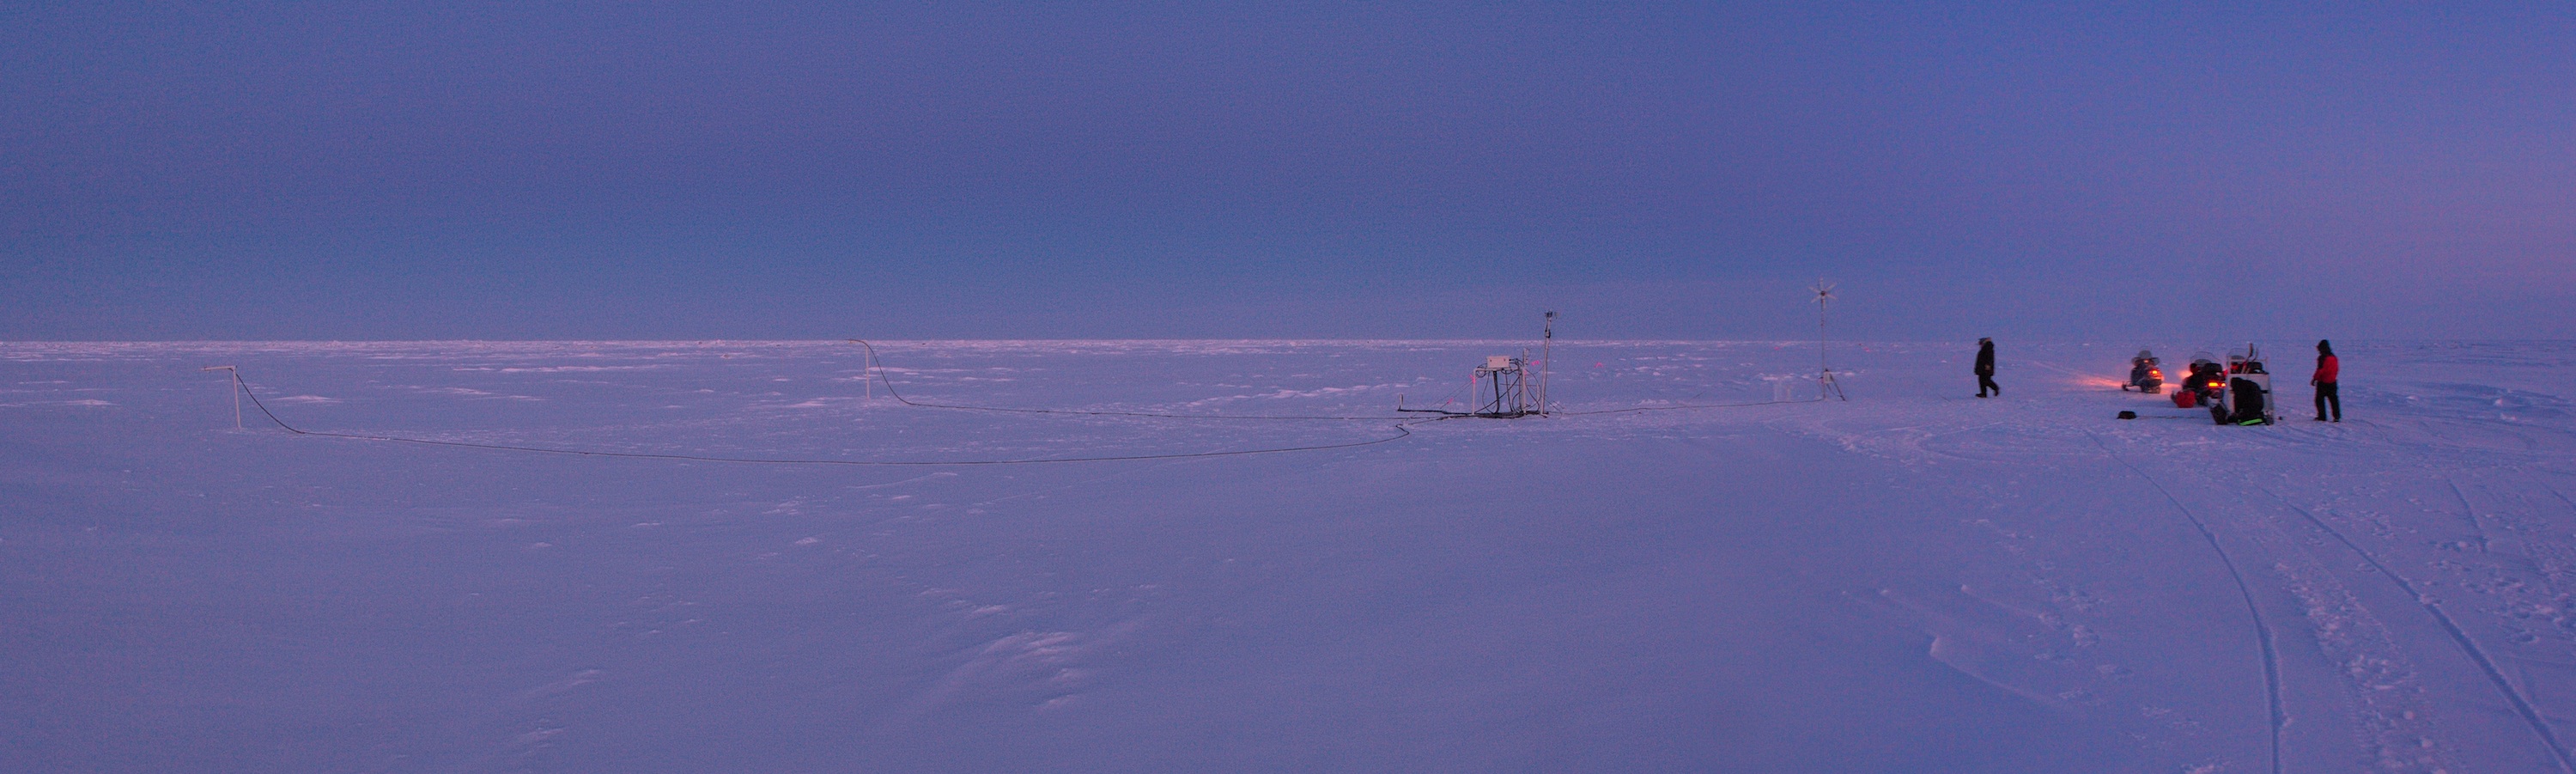
The Mass Balance Site was deployed on landfast sea ice in the Chukchi Sea at Barrow, Alaska on January 11, 2012. At the time, ice thickness was 0.97 m (38 in) and snow depth was 0.05 m (2 inches).
Ice thickness, snow depth, sea level, and temperature profiles are recorded every 15 minutes, transferred to Fairbanks, processed and presented online with approximately 5 minutes delay.
Recovery of the Mass Balance Site took place on June 17, 2012.
The Mass Balance Site was damaged in early February, probably from an encounter with a polar bear. All three snow pingers were knocked over, the pvc supports for the data logger box were destroyed, and the radio antenna cable was damaged beyond repair. In late February, the snow pingers were remounted and the logger box was placed in a snow pit. The data was not capable of being sent to our servers, although the full data set is available at the link below.
Overview
The Mass Balance Site consists of the following sensors:- in-ice thermistor string: temperatures at different positions above, through and below the ice
- above-ice temperature/humidy sensor: air temperature and humidity
- above-ice down-looking acoustic transducers: the position of the upper snow or ice surface
- below-ice upward-looking acoustic transducer: the position of the ice bottom
- below-ice down-looking acoustic transducer: local sea level at the Mass Balance Site
- below-ice thermistor: water temperature

Ice thickness is calculated from the distance between the upper and lower surfaces of the ice
In winter the positions of the upper and lower surfaces allow us to determine snow accumulation and ice growth, respectively
In spring and summer, our measurements show the thinning that takes place from above and below.
Measurements are performed every 15 minutes and transferred to a base station in Barrow through a 900 MHz UHF radio link, from where they are sent through an internet connection to Fairbanks for further processing.
A detailed description of the set-up is available in the metadata file: BRW12_MBS_metadata.txt. Please read the metadata before using data from the Mass Balance Site. Note that data format and metadata file may change during the season without notice.
Link to raw data: BRW_MBS_2012_raw.txt
Link to processed data: BRW_MBS_2012.txt
Data from previous years can be found here
Site location
The Mass Balance Site Instruments is located at 156.5427° W, 71.36427° N in a region of undeformed landfast sea ice at Barrow, Alaska. This is approximately 1 km (1/2 mile) offshore, North of Niksiuraq, the northern end of the road toward Point Barrow. Locations of the MBS in previous years are shown on this map.Data plots
Plots on this page are generated in near real-time from automatically processed data prior to human quality control.
|
|
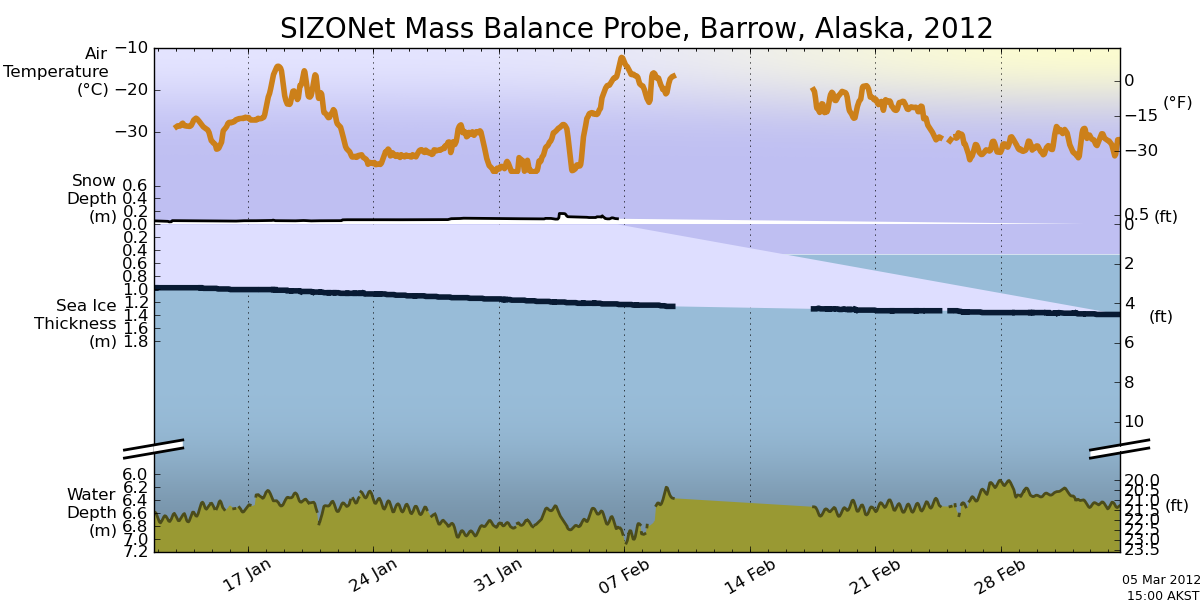
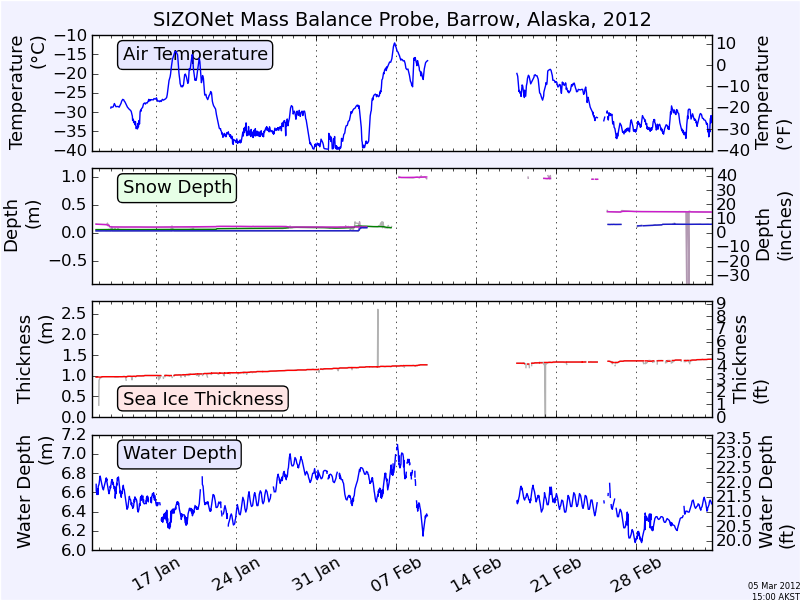
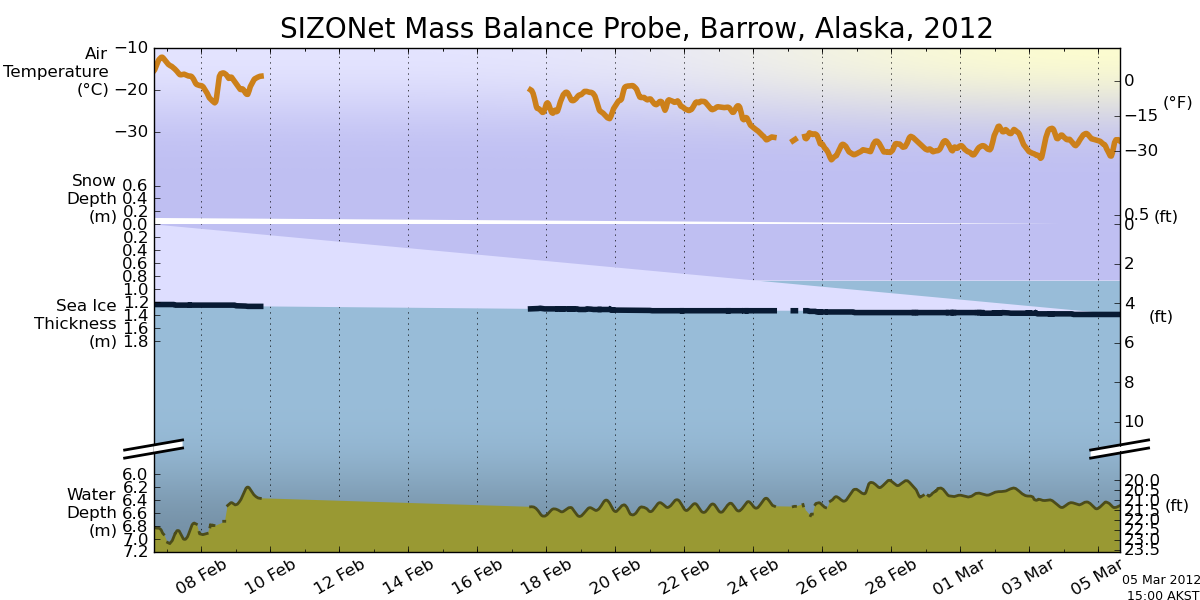
Measurements at the mastThis plot shows the air temperature, snow depth, ice thickness and water depth measured at the mast of the Mass Balance Site. Snow depth and ice thickness are derived from acoustic sounders that take one measurement every 15 minutes. The accuracy is about ±1 cm (±1/2 inch). Data are filtered for this plot; unfiltered data are shown below. |
|
|
Temperature profileThis is the temperature profile through air, snow, ice, and water. The grayed area indicates the position of the ice (bottom may be off by 0.1 m). The bounds of the red funnel are the highest and lowest temperatures recorded during the past 24 hours. The black line with data points (spaced 0.1 m, 4 inches) is the latest temperature profile. Air, snow, ice, and water can often be discriminated easily in winter and early spring: daily temperature swings are more pronounced in the air than in the snow; the temperature profile in the ice is usually linear and steeper than in the snow; the temperature in the water is approximately independent of depth. Towards summer the ice acts as a heat sink with the coldest temperature registered inside the ice rather than in the air. Temperature measurements are accurate to approx. ±0.2 °C. Further, measurements in summer may be affected by solar heating of the probe. |
|
|
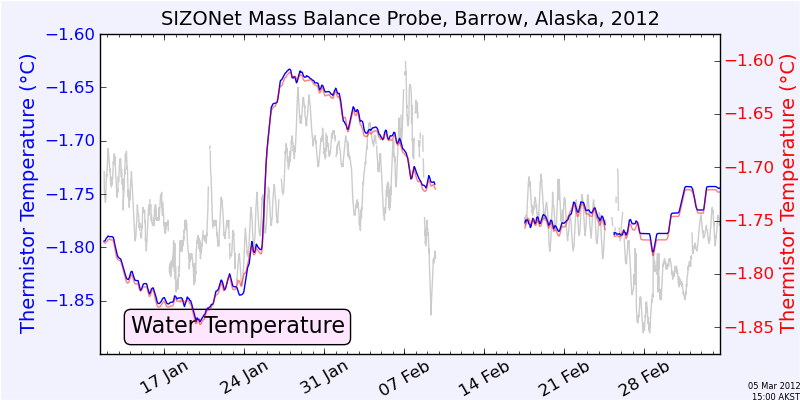
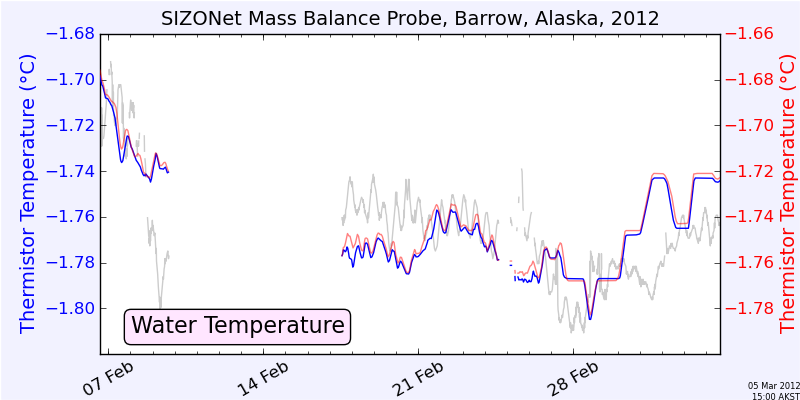
Water temperatureThis figure shows the water temperature approx. 1 to 2 m below the ice as detected by the bottom-most thermistor at the string of temperature sensors (blue), and by the thermistor 30 cm (1 ft) above (red). Data are smoothed by a running average filter with 6 hour window. The temperature readings are only crudely calibrated to ±0.2 °C. Note that both sensors may be heated by incident solar energy. The line in light gray is the tidal signal. |
|
|
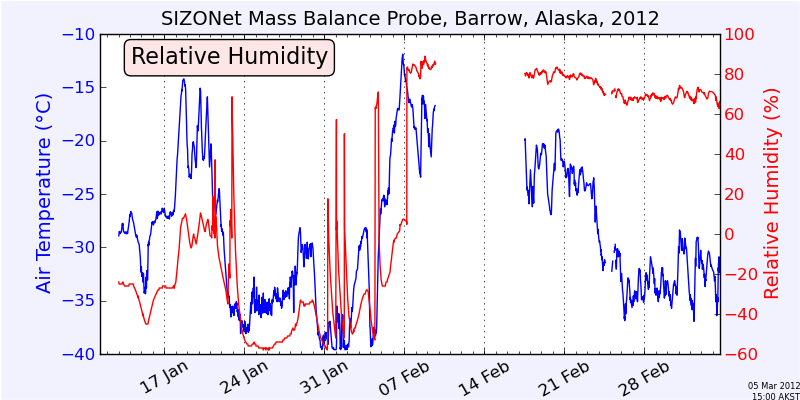
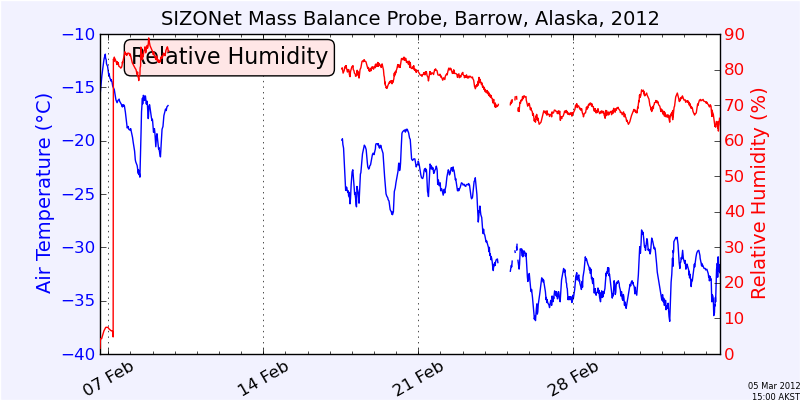
Relative humidityThese are air temperature and relative humidity, both measured by the Campbell CS500 probe enclosed in a radiation shield on the pinger mast. |
|
|
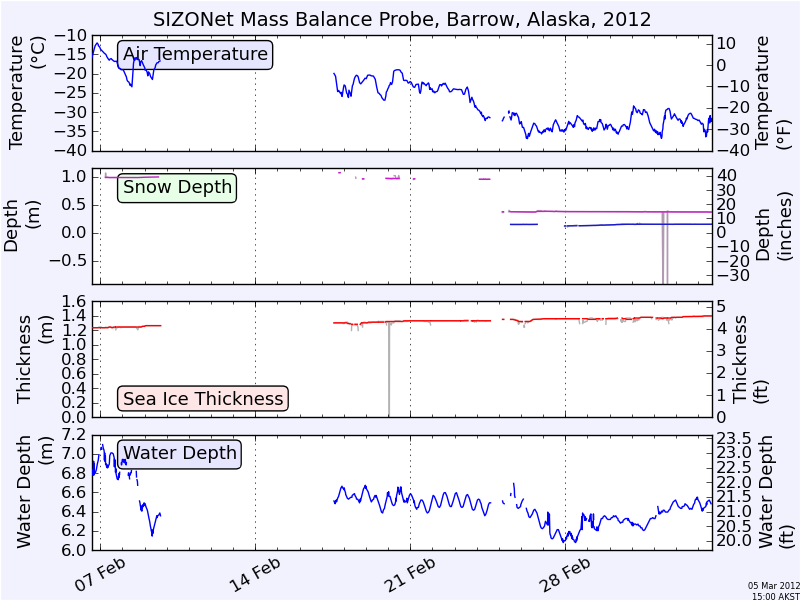
Depth and thickness soundingsThis plot shows the air temperature, snow depth (three locations), ice thickness and water depth measured at the mast at the Mass Balance Site (see figure above). Snow depth and ice thickness are derived from acoustic sounders that take one measurement every 15 minutes. The accuracy is about ±1 cm (±1/2 inch). The colored lines are snow depth and ice thickness data smoothed by a median filter with a 24-hour window. The actual measurements are shown in light gray underneath. Snow depth and ice thickness are spot measurements rather than aerial averages. There are snow dunes on the ice that may be 60 cm (2 ft) deeper than the thinnest snow; the measurements by the pingers are probably somewhere between the extremes. Similarly, the thickness of level ice varies in the general area surrounding the Mass Balance Probe. |
|
|
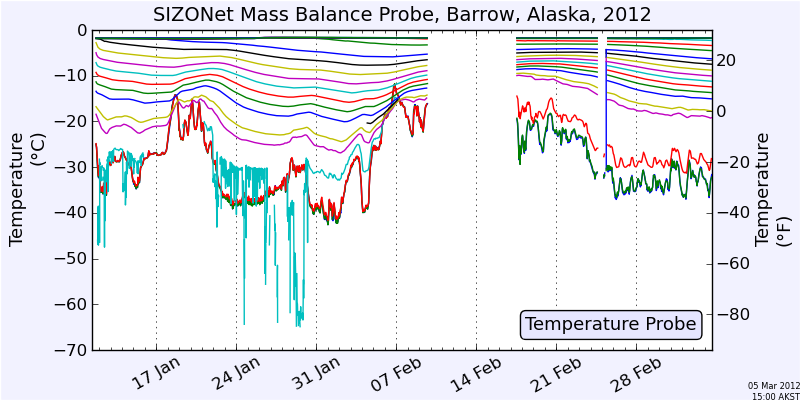
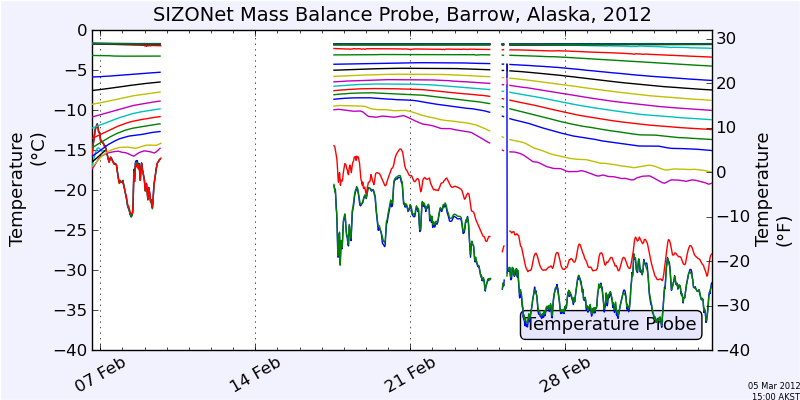
Temperature ProbeThe temperature probe measures the vertical temperature at 10 cm (4 inches) intervals, starting 70 cm (2 ft) above the ice surface at the time of deployment. This plot shows those temperature measurements, i.e. temperature in air, snow, ice, and water. In winter and spring, the coldest and warmest temperatures are measured in the air and water, respectively. In summer, the air temperature exceeds the melting point and snow and ice melt both from the top and from the bottom. The current temperature profile is shown above. |
|
|
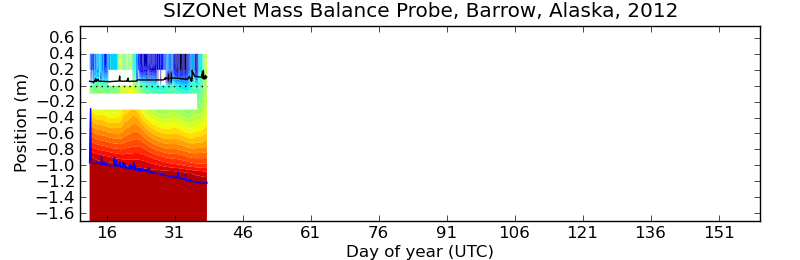
Temperature ProfileColor-coded temperature vertical profile through air, snow, ice, and water. Also indicated are are the position of the ice bottom and snow surface measured at the pinger mast. |
|
|
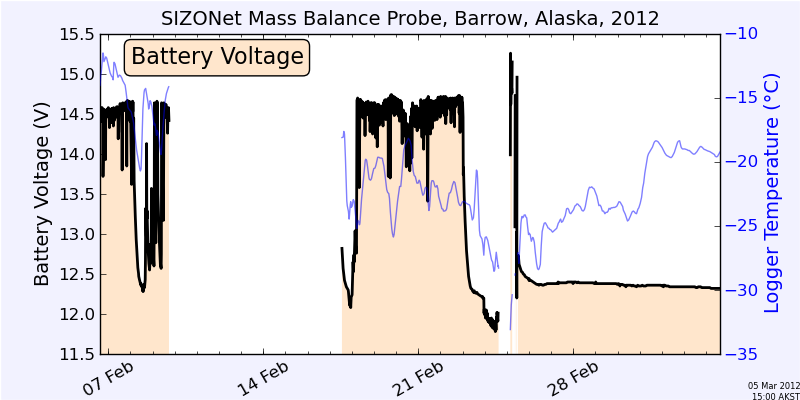
Supply voltageThe Mass Balance Site is powered by two lead acid batteries attached to a wind turbine. On windy days (10 knots and above) power is delivered by the turbine and the batteries are being charged. The charge voltage increases with wind speed but is capped by a temperature-compensated charge controller. On windy days, the voltage should be above 14 V, indicating that the batteries are being charged. On windless days, the battery voltage can be used to estimate the available charge. Currently, the voltage is 12.31 V. A voltage of 10.5 V is typical for drained lead acid batteries. This is higher than the minimum voltage required for the data logger (9.6 V) and for the UHF radio (6 V). Our goal is to maintain the battery voltage above 11.5 V. |
|
|
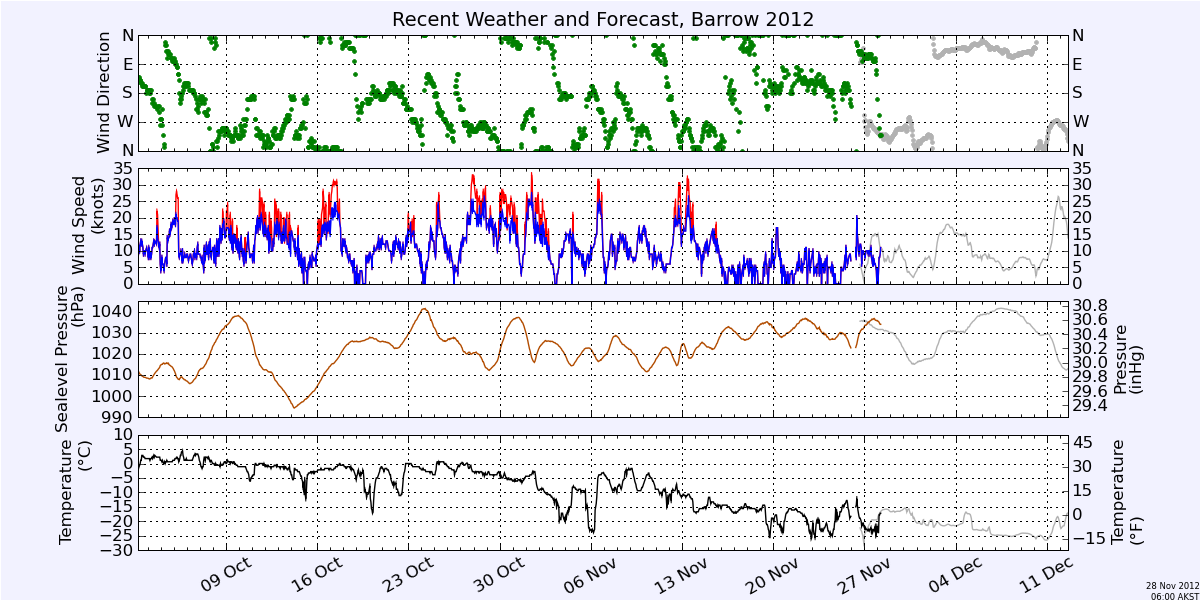
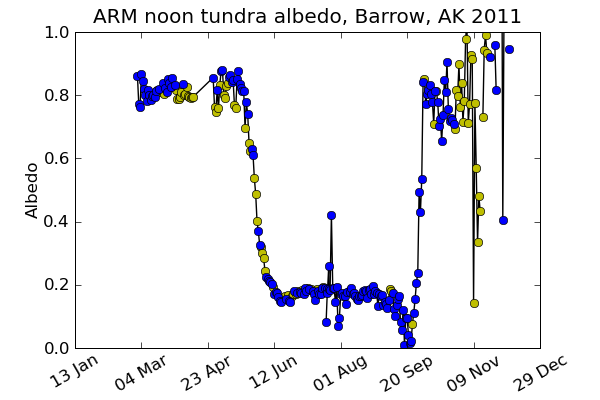
Recent weather and forecastThis is a summary of recent weather observations at the Barrow airport (courtesy NOAA)and a weather forecast for Barrow based on a regional weather forecast model (courtesy Zhang and Krieger, ARSC). Refer to NOAA ET-SURGE for surge prediction. Note that weather forecasts are unreliable beyond approx. 3 days. See also webcam (archive) snapshots of the last 24 h and the last 14 days, and tundra albedo.
|
| This project is supported through the Alaska Ocean Observing System (AOOS) with logistical and technical support provided by the Barrow Arctic Science Consortium (BASC). We also gratefully acknowledge the Arctic Slope Regional Corporation (ASRC) for supporting installation of the webcam and radar. This material is also based upon work supported by the National Science Foundation under Grant No. OPP-0856867. Any opinions, findings and conclusions or recommendations expressed in this material are those of the author(s) and do not necessarily reflect the views of the National Science Foundation (NSF). | |


Contact: massbalance@gi.alaska.edu